Time For The Next Major Bitcoin Move
In the previous newsletter, I announced that I believed Bitcoin had bottomed. That certainly seems to have been correct, as Bitcoin has now rebounded and approached all-time-highs.
Here’s what we expect next over the coming weeks…
- Bitcoin to break out above all-time-high.
- Move towards $70,000 (and beyond).
- Supported by significant spot buying + lack of selling from long-term HODL’ers.
- Then potentially topping out in the medium term…keep an eye on the key indicators in this newsletter.
Technical Analysis
We continue to expect $BTC price to respect the fib levels on this fib extension we have been using for several weeks now.
Once $BTC reclaims its previous high of $59,000 that should open up the door for a move up to our second take profit level at the 1.618 fib extension. Which is a price target of $70k.
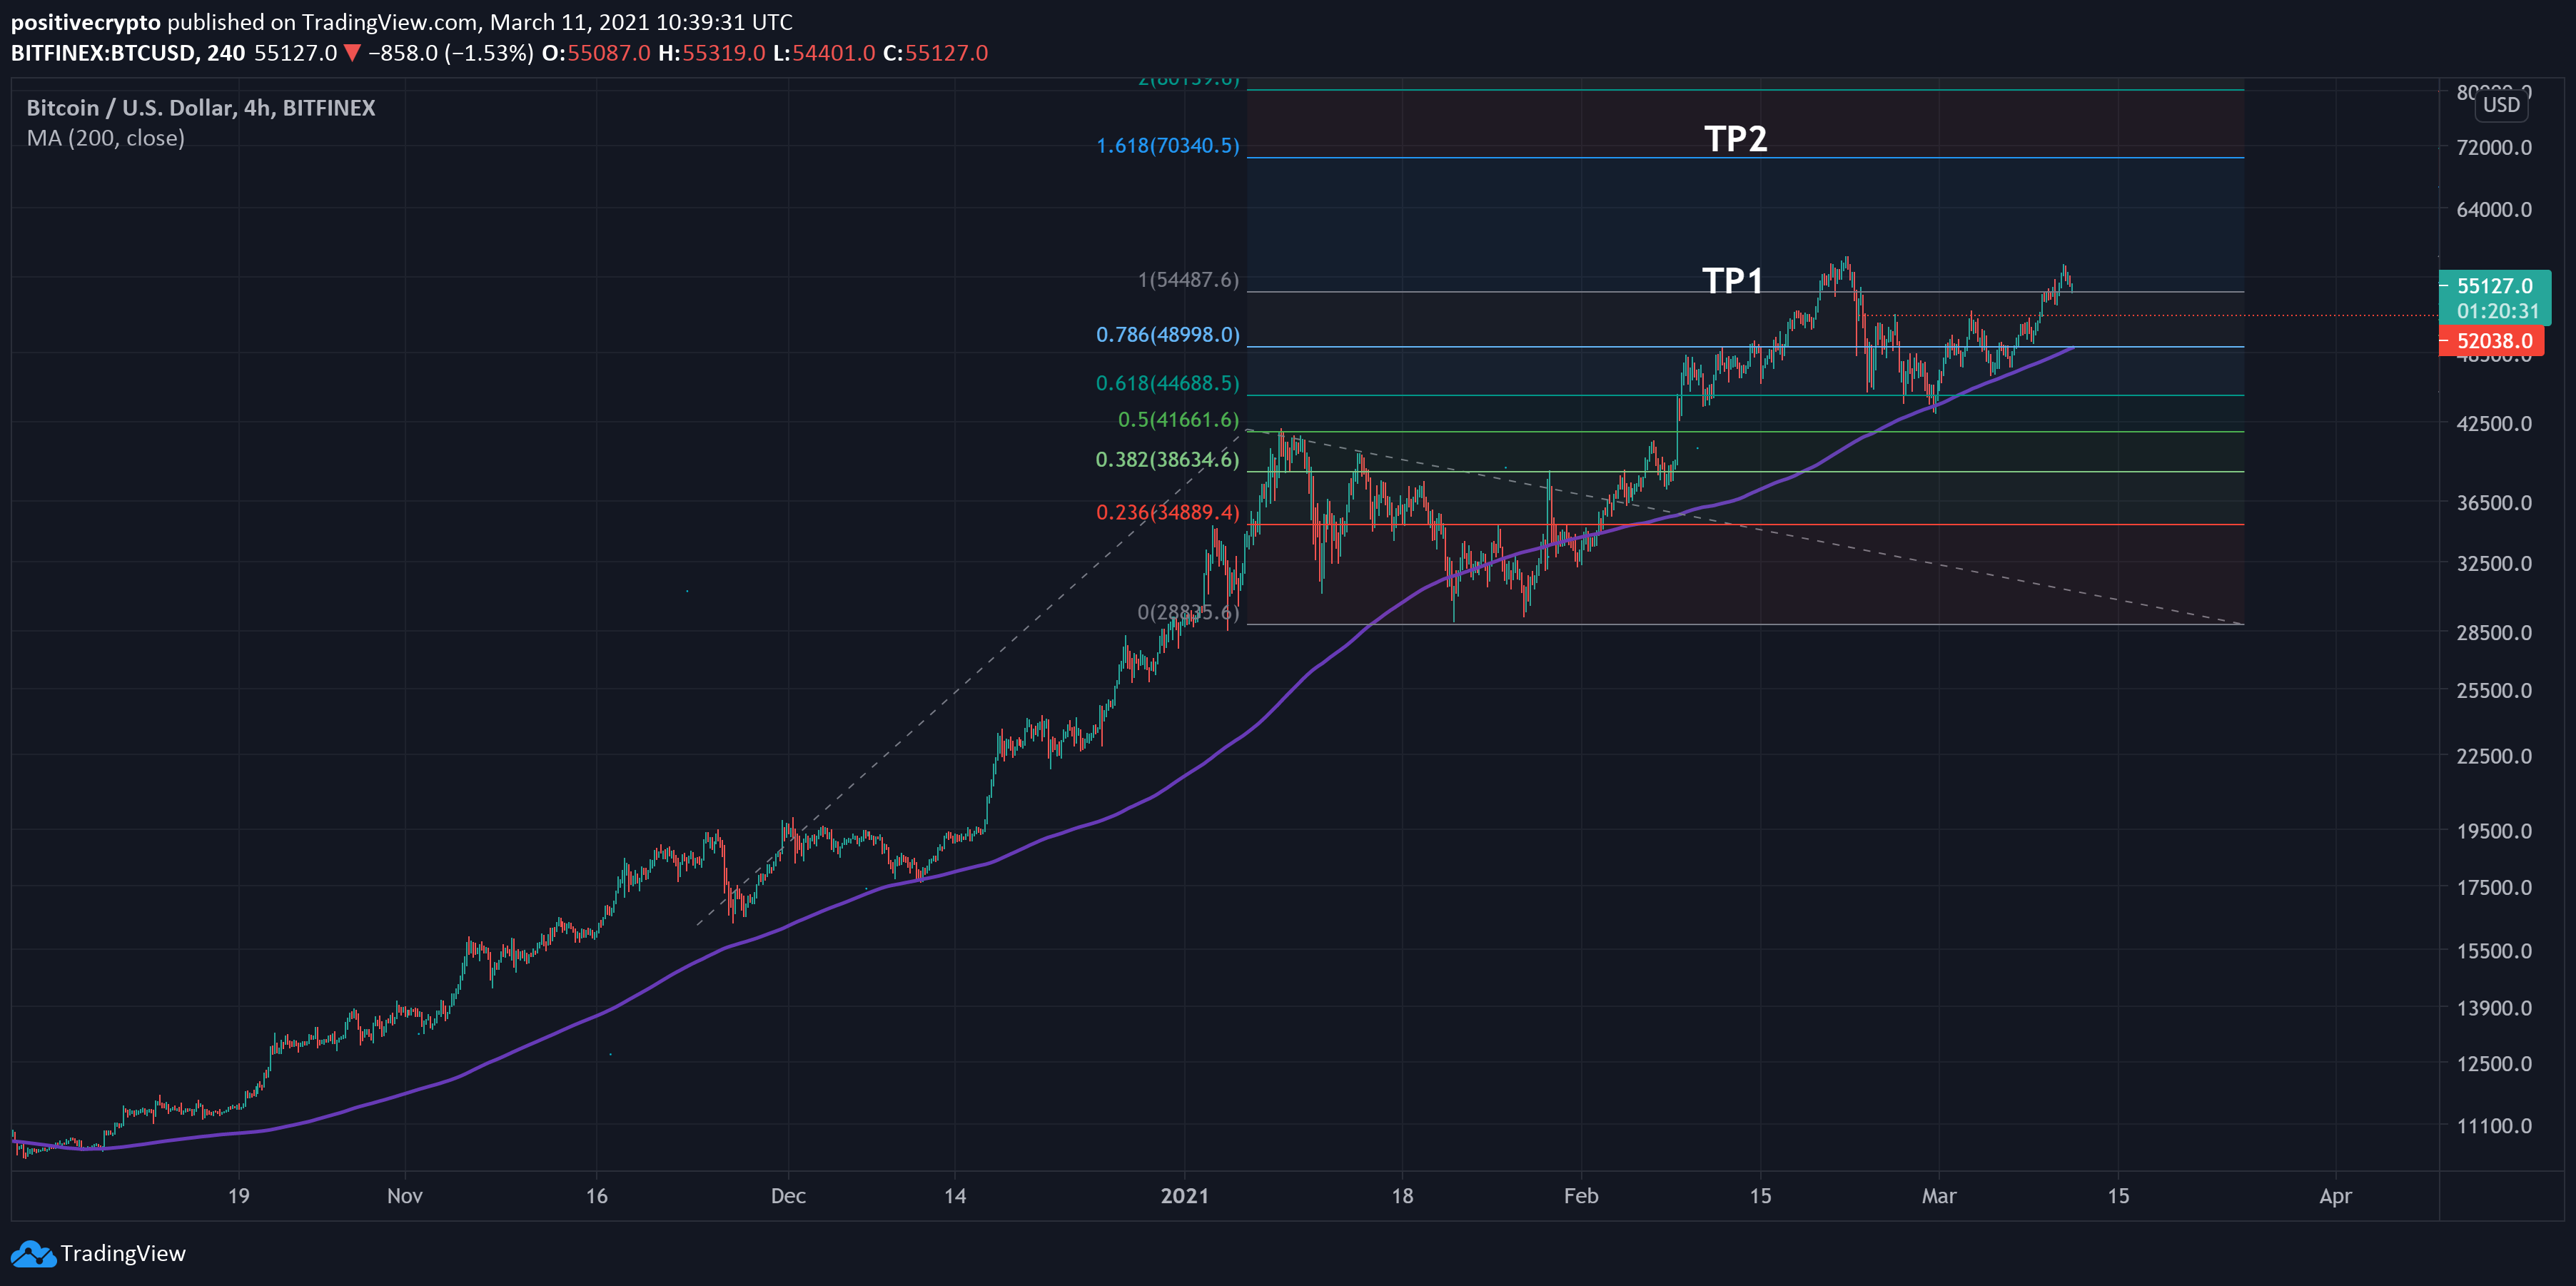
Fig 1: $BTC technical outlook
As long as $BTC stays above the 200ma (purple line) on the 4hr, which it has done for most of this bull move up since October last year, then the bullish structure remains intact.
The 200ma is currently at $49k and rising fast.
Funding
Price action on low time frames the past 48hrs has been choppy. We believe a key reason for this can be seen in funding rates across different exchanges. What we are noticing is that Bybit funding rates keep jumping up higher versus other exchanges. This is likely ‘degenerate’ traders anticipating $BTC breakouts and over-leveraging long. The result is that they are getting liquidated on choppy price action as market makers seek out their liquidation levels.

Fig 2: Funding more than twice as high at Bybit versus other exchanges.
Given the macro context is so bullish for $BTC right now, in our opinion, it pays to be patient and not get liquidated on low time frames when larger moves are likely just around the corner.
Significant spot buying taken off US / European exchanges
The rapid reduction of bitcoin available on Coinbase and Bitstamp in recent months continues – as can be seen on the chart below. The amount of bitcoin held on Coinbase is shown in blue, and for Bitstamp in green.
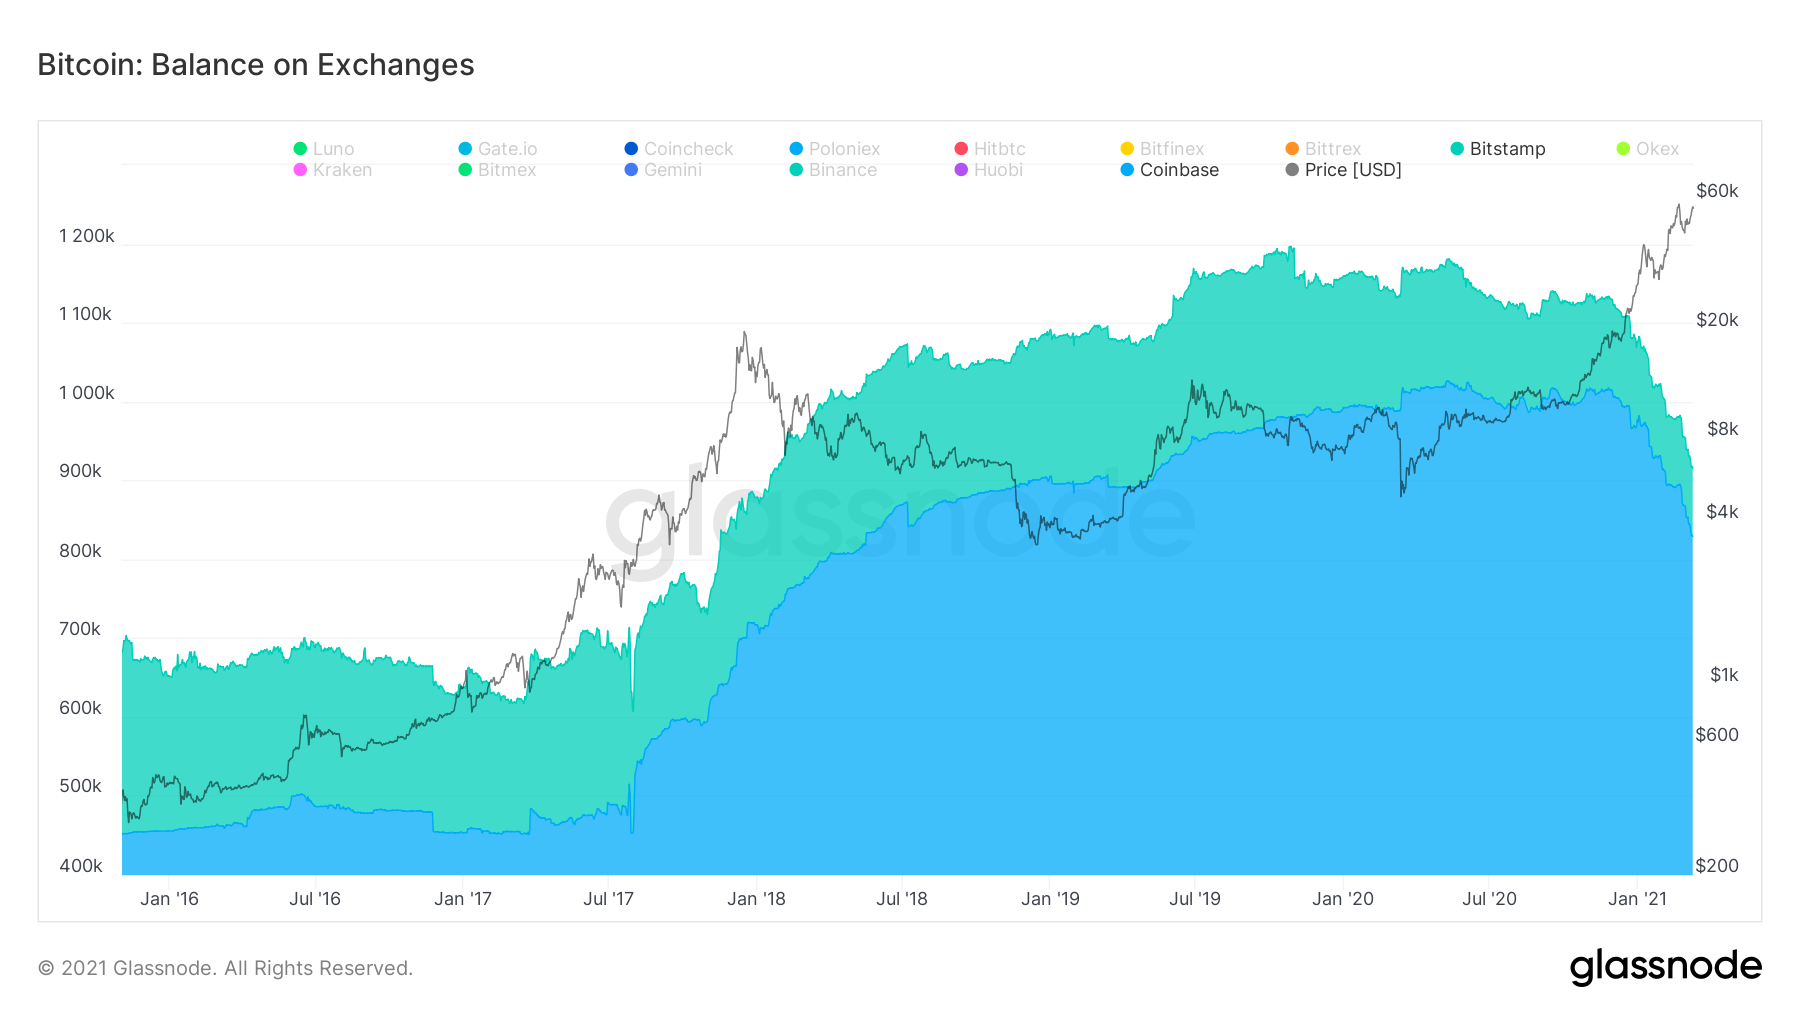
Fig 3: Massive drop in bitcoin available on Coinbase and Bitstamp since late 2020
This is bullish because a significant amount of the reduction is being driven by people and institutions taking bitcoin off exchanges to keep in cold storage. Which reduces the liquid supply available on the market that could be sold quickly.
It is worth noting that a decent proportion is also being wrapped as WBTC and being put to use in DeFi protocols. While reducing the amount available on exchanges, this somewhat reduces the bullish narrative as we would argue that wrapping bitcoin is less ‘liquidity reducing’ than putting bitcoin into cold storage. Nevertheless, it furthers the use cases of Bitcoin, which is long-term bullish.
Long term HODL’ers are not selling
As we move through the bull market, we are seeing that the amount of coins being HODL’d for 1yr+ and even 2yr+ are now starting to be sold as ‘shorter term’ HODL’ers start to realise some profits.
However, 3yr+ HODL levels are actually increasing! As Bitcoiners who have experienced a previous full cycle understand that Bitcoin still likely has a lot more upside to go.
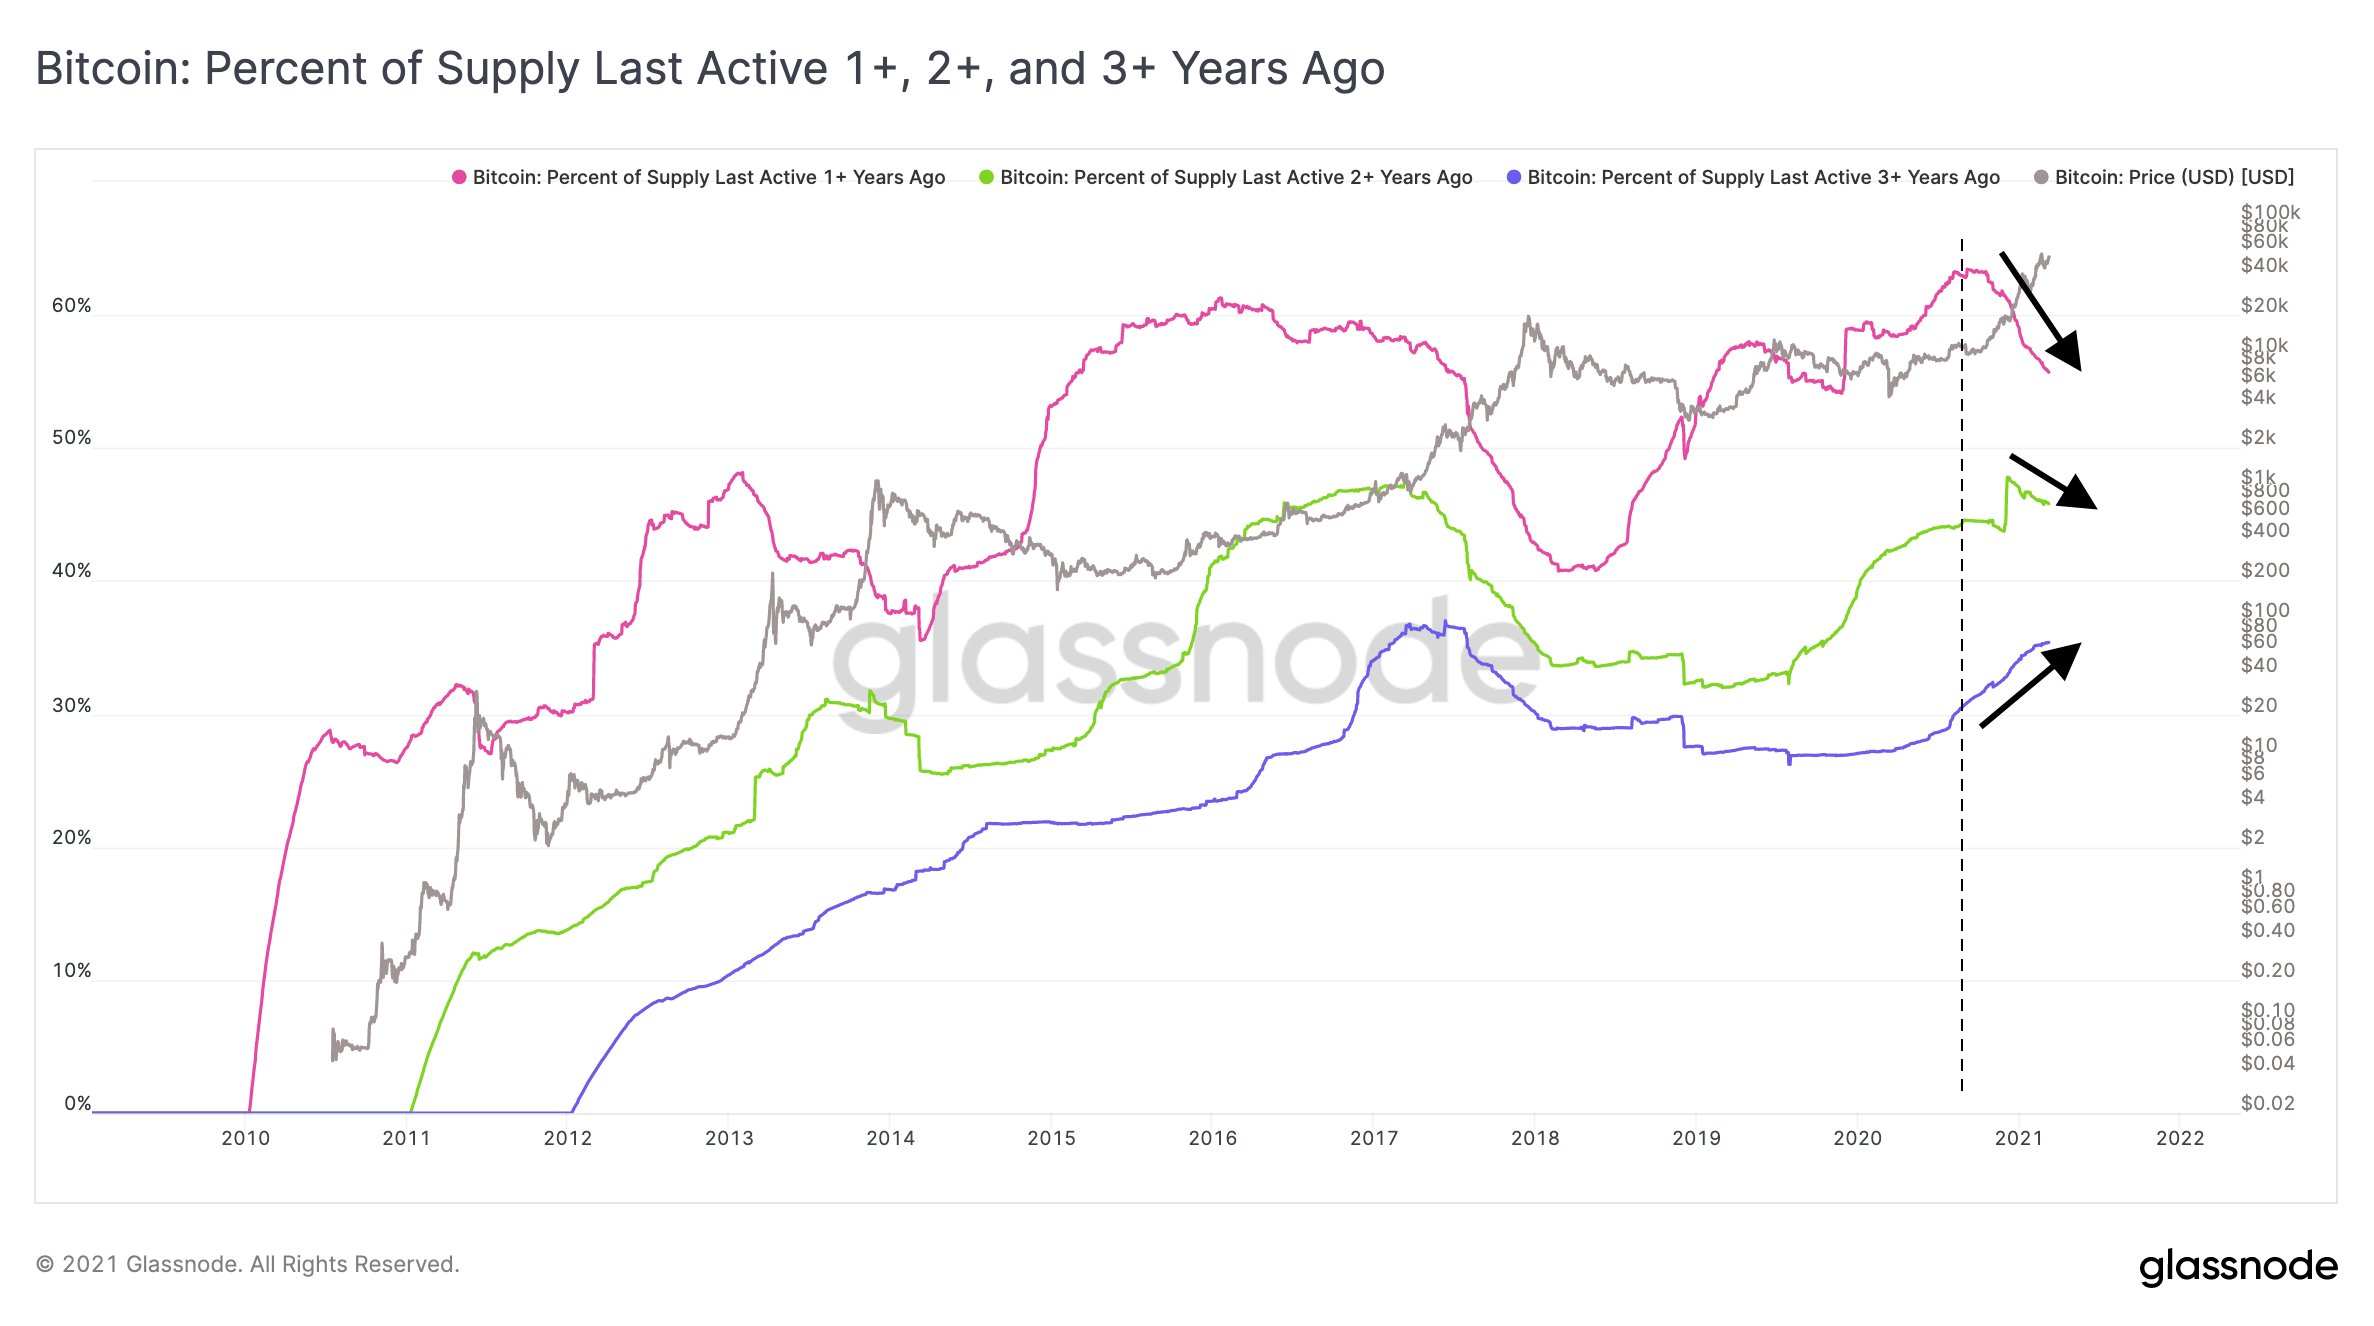
Fig 4: 1yr+ (red line), 2yr+ (green), 3yr+ (blue) HODL waves
h/t: https://twitter.com/n3ocortex
Looking at that chart, it is possible to see where we are compared to the previous 2017 cycle when these HODL lines were behaving in a similar way… approaching roughly half-way through the cycle in our opinion.
What role will miners play?
There is a lot of talk on crypto twitter at the moment about the reduced importance of bitcoin miners in the overall supply:demand picture for Bitcoin. This is because the amount of Bitcoin now being mined a day post halving is relatively small compared to estimates of institutional buying.
While this may be true, it is not impossible to imagine a scenario where miners could trigger a cascade of selling with their overall bitcoin holdings.
An indicator that can help us gauge this is the Puell Multiple which looks at miner revenues today versus historical norms.
We can see below that when $BTC price has gone parabolic in its macro cycles, the Puell multiple enters the red zone as miners look to realise $BTC profit. This historically triggers a major sell off in price:
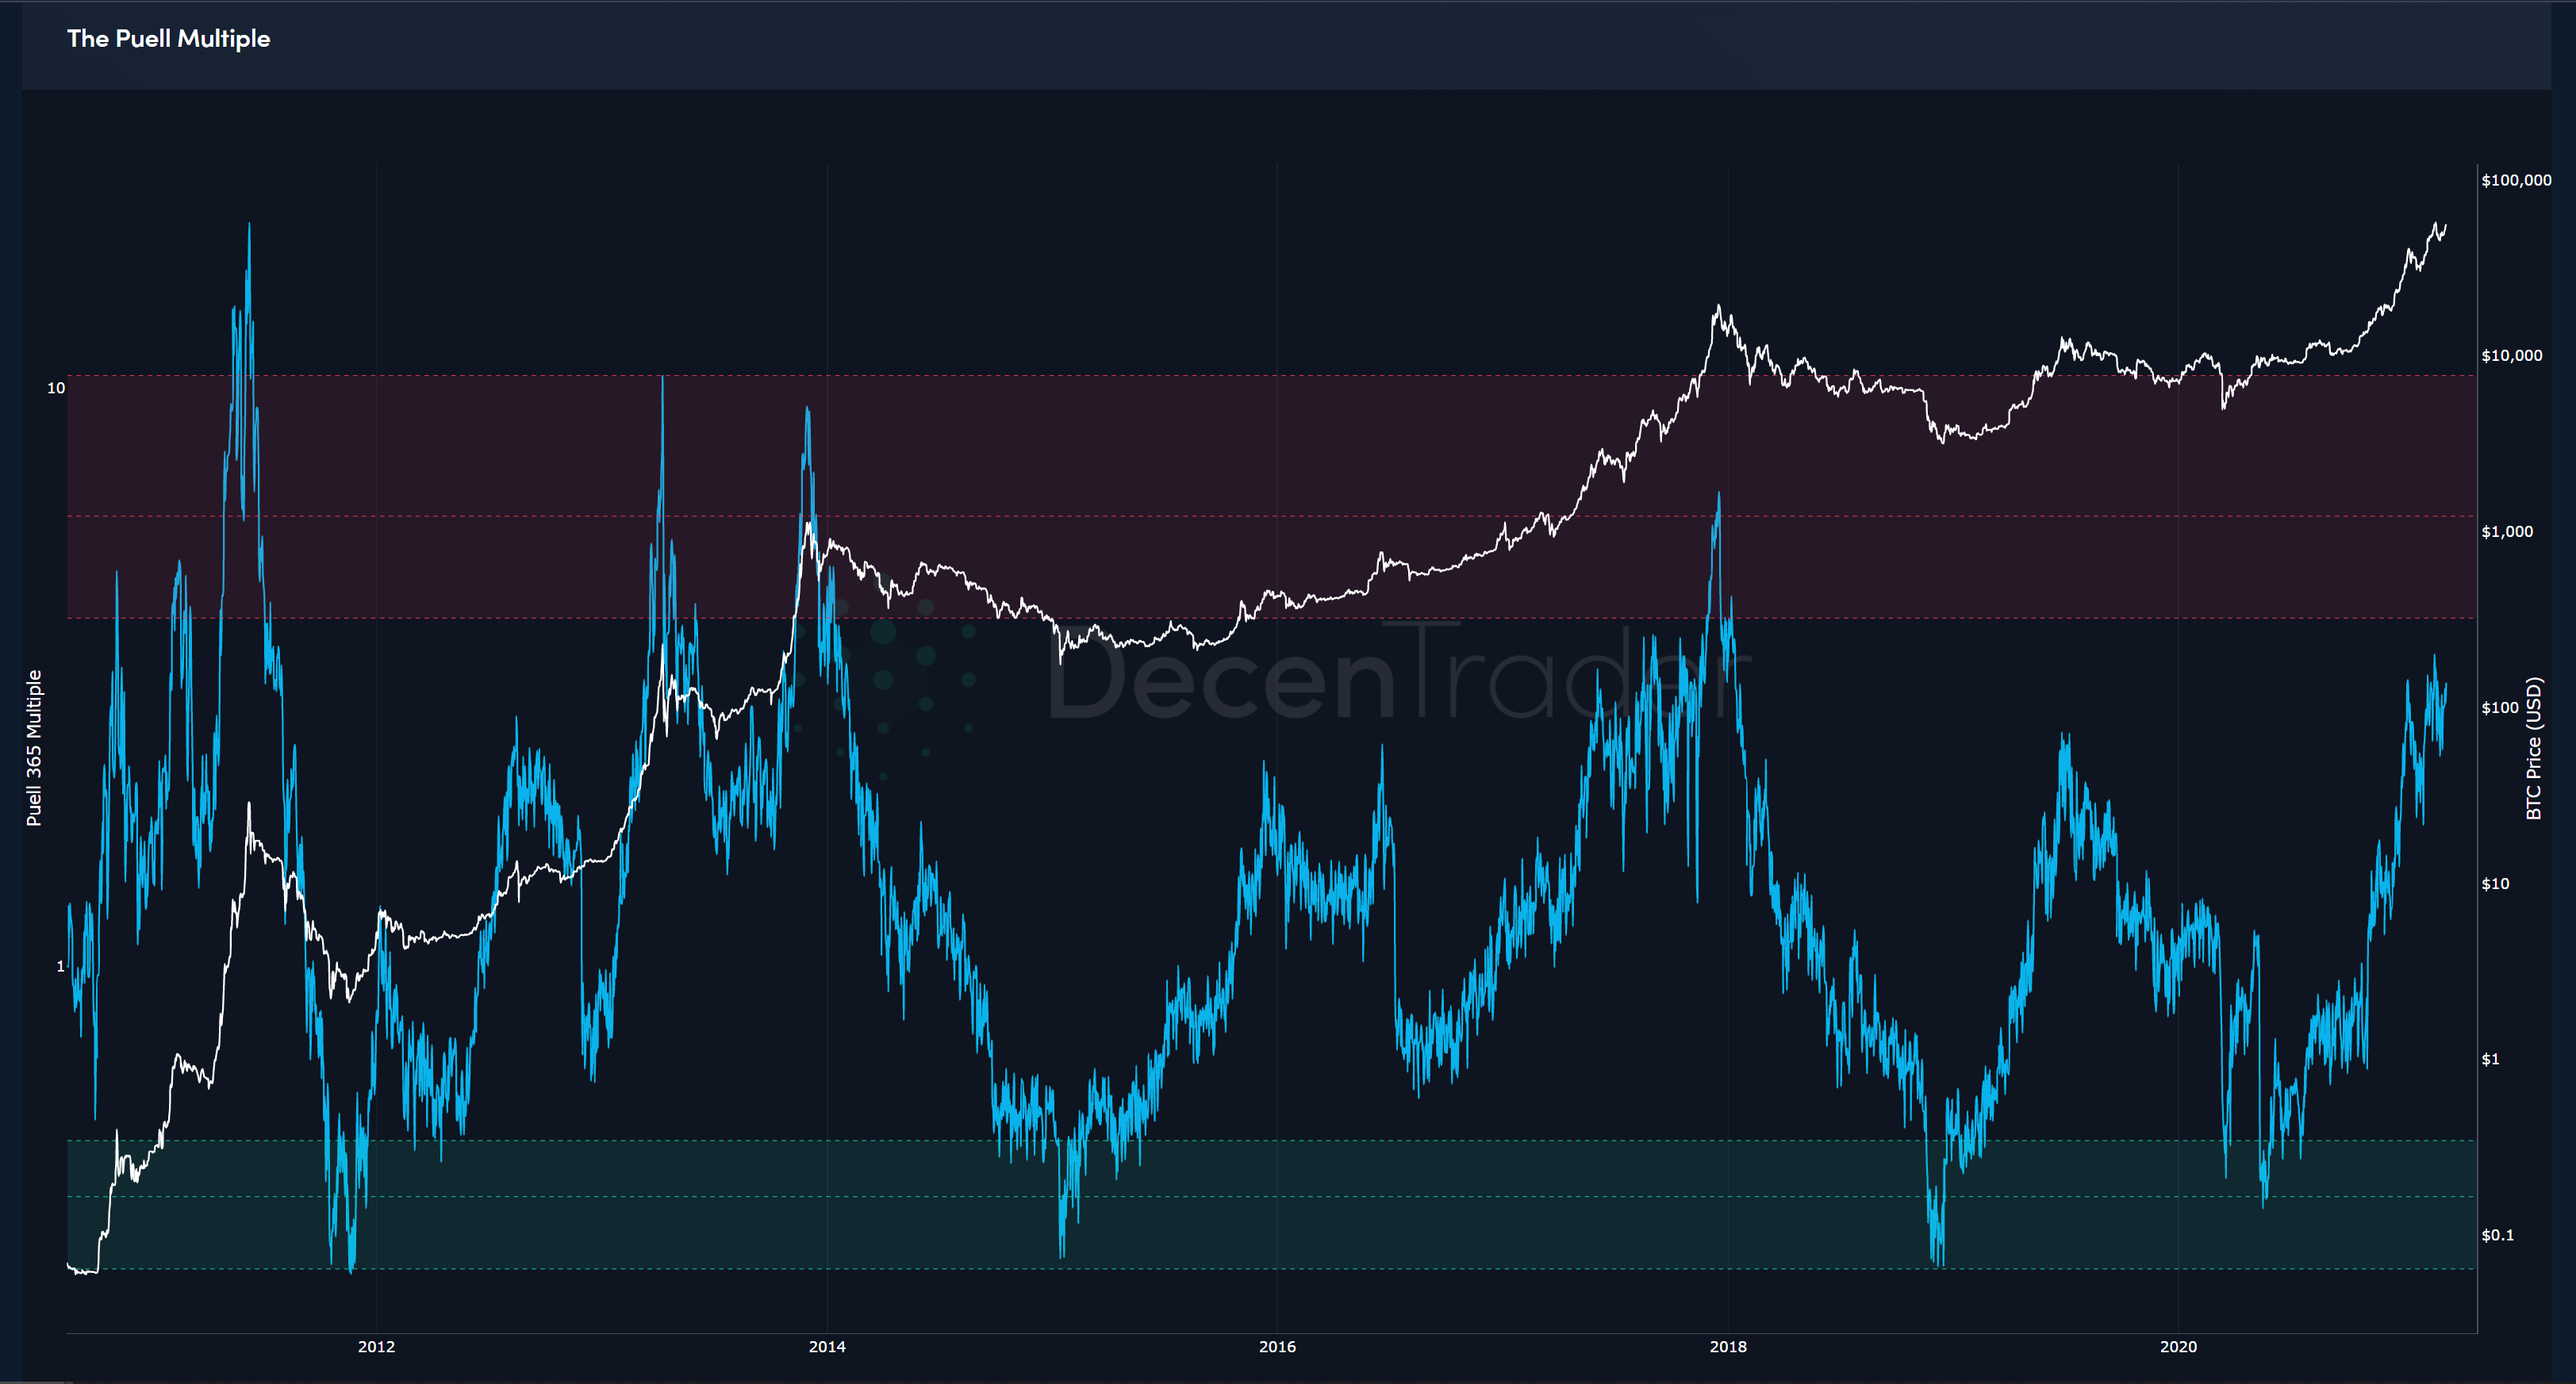
Fig 4: Puell Multiple entering the red band has previously triggered major sell-offs
Currently, the indicator is resting below the red band. However, if $BTC were to go parabolic over the coming weeks, say beyond $80k, then it is likely that this indicator would enter the red zone, suggesting price may at least be topping out in the near term.
Decentrader subscribers will be alerted to this indicator entering that zone via our alert bot.
Pi Cycle Indicator
Finally, another indicator that may signal a near-term top should $BTC start accelerating up over the coming weeks is the Pi Cycle Top indicator.
This indicator picked the three previous major price tops to within 3 days! Which is pretty accurate. There is no guarantee it will work again as it assumes steady movement through an adoption process, but it is another indicator that is now worth paying attention to as it approaches critical levels.
It uses two daily moving averages, the 111DMA and 350DMA x2.
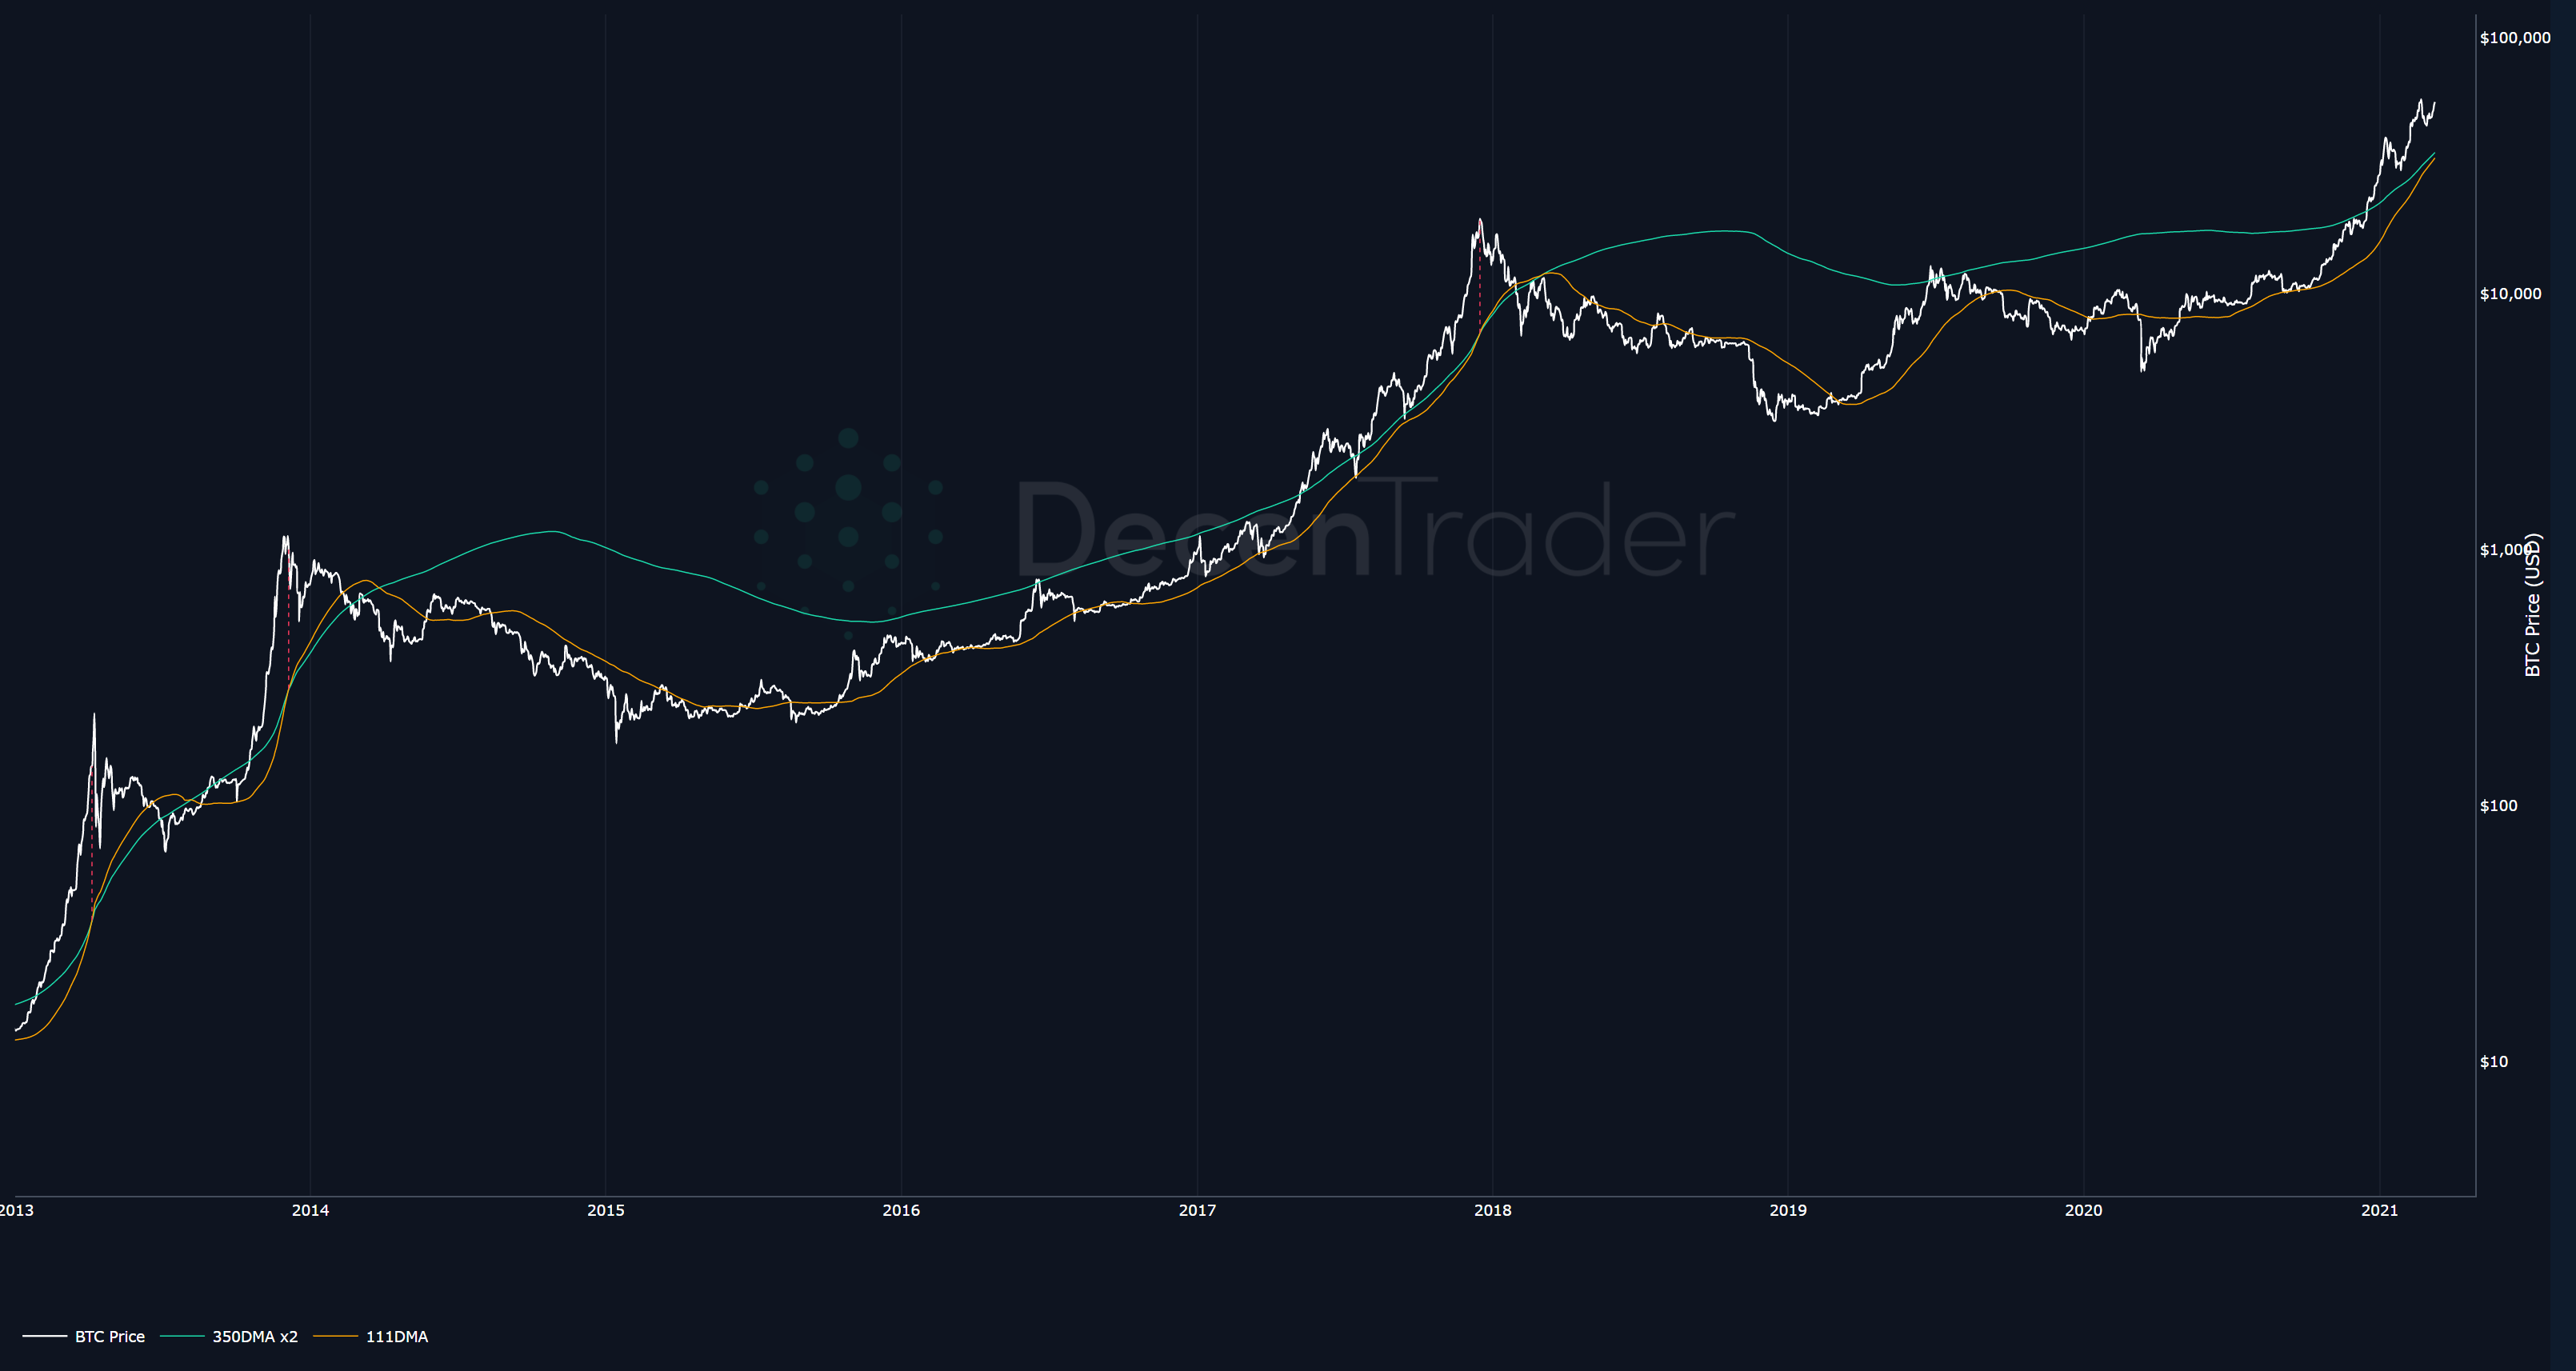
Fig 5: Major price highs when the 111DMA (orange line) crosses above the 350DMA x 2 (green line)
We can see that once again the 111DMA (orange line) is now catching up and close to crossing the 350DMA x2.
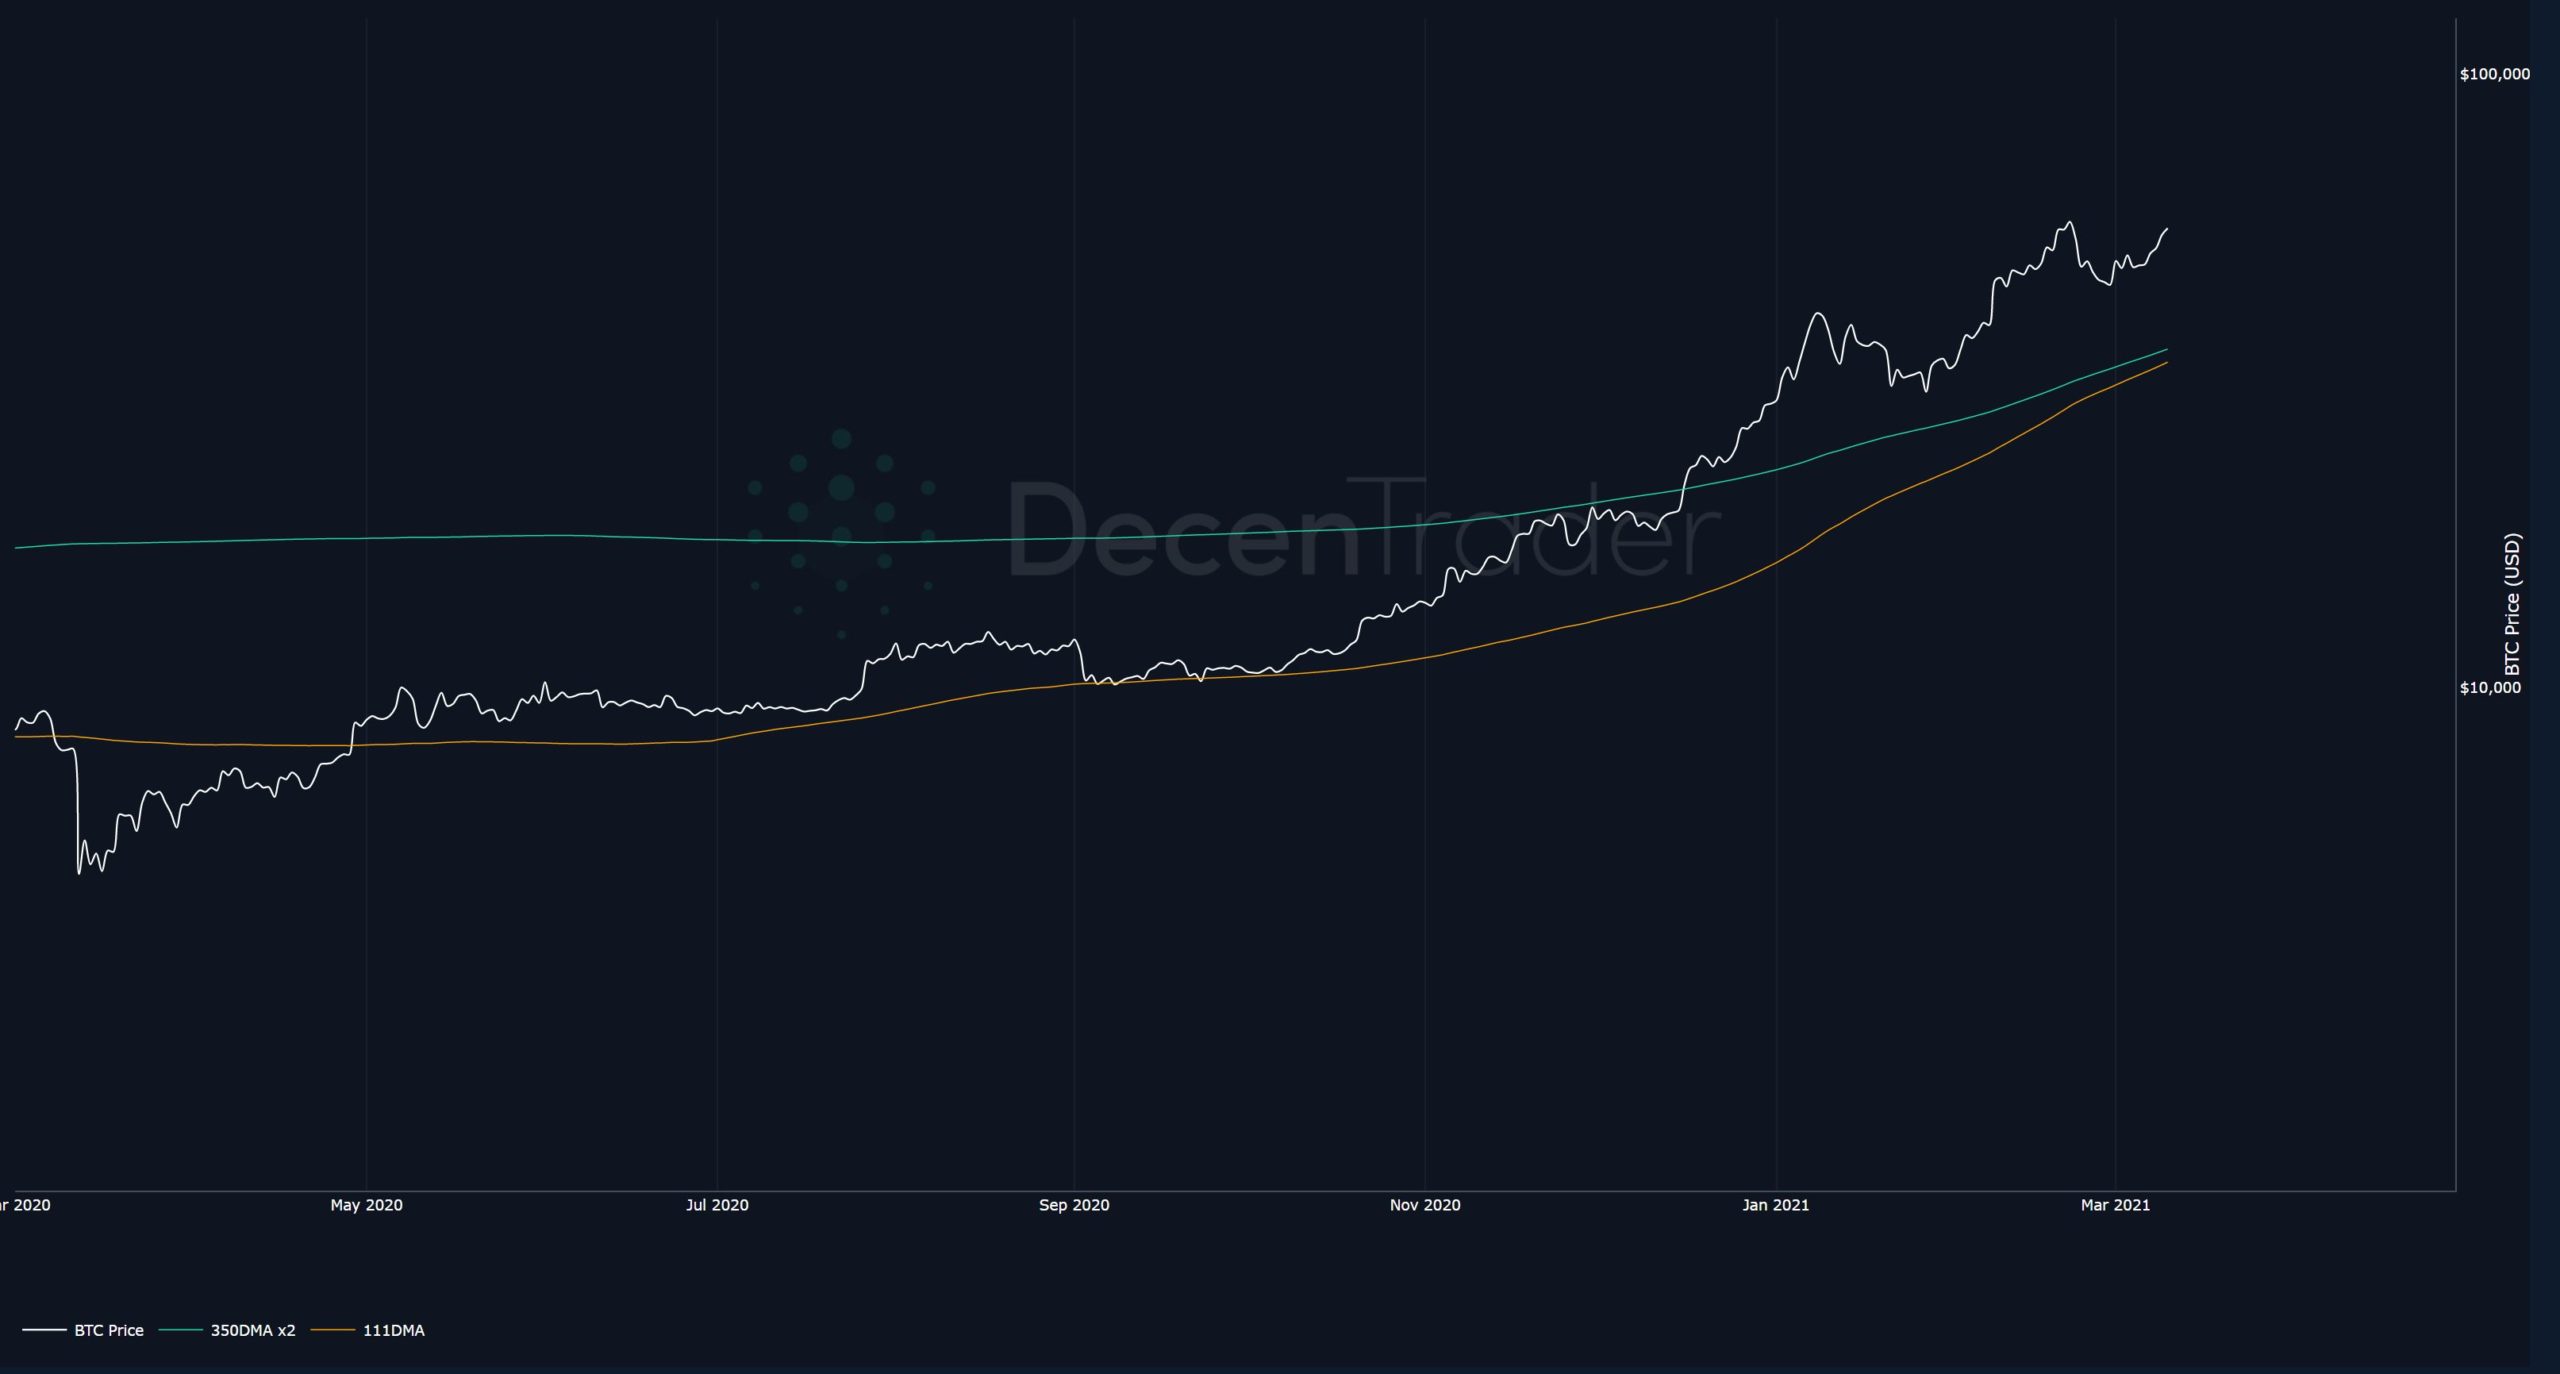
Fig 6: Zooming in, the moving averages are close to crossing again
Will $BTC price top out when they cross again? No one knows. All these indicators are experiments to give us an understanding of how Bitcoin price moves through time. But it is exciting to see what, if anything, will happen when they cross soon.
So we may have an exciting few weeks ahead of us with $BTC potentially accelerating up before some kind of pullback. Let’s see if that plays out.
Stay alert, stay safe, and speak again soon.
Philip Swift
The Decentrader Team.
Want to learn more? Subscribe HERE.
Disclaimer: Nothing within this article should be misconstrued as financial advice. The financial techniques described herein are for educational purposes only. Any financial positions you take on the market are at your own risk and own reward. If you need financial advice or further advice in general, it is recommended that you identify a relevantly qualified individual in your Jurisdiction who can advise you accordingly.


