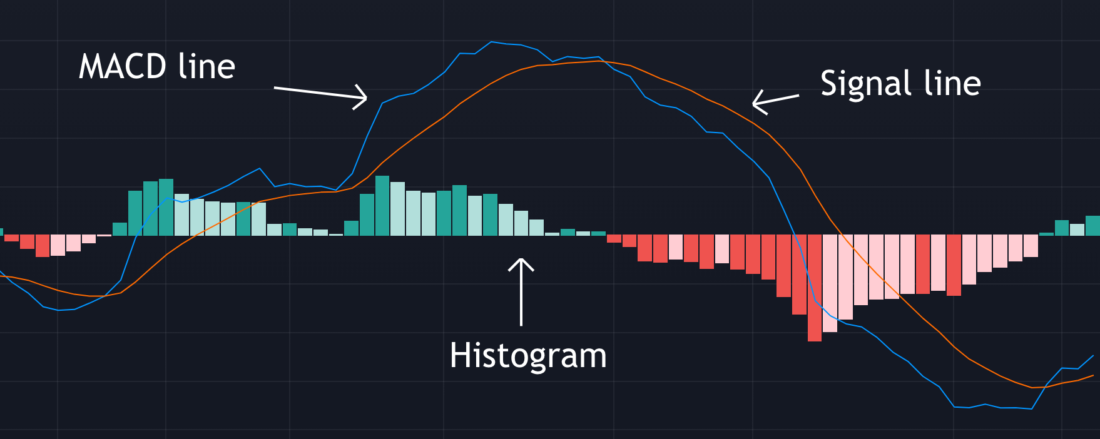
MACD stands for Moving Average Convergence Divergence. It is a popular momentum and trend indicator. It’s comprised of three parts: the MACD line, the Signal line and the MACD histogram.

MACD Line
Although the values can be adjusted, the most common set up for the MACD line is the difference between the 12 and 26 period exponential moving average.
Signal Line
Again, it’s possible to adjust the value, but normally this is the 9-period exponential moving average of the MACD line.
MACD histogram
The histogram represents the difference between the MACD line and Signal line. If the MACD line is above the Signal line, then the histogram is green and above 0. If the MACD line is below the Signal line, the histogram is red and below 0.
If the histogram is a greater value than the previous period, it will be a dark shade. This suggests a strong momentum in the trend. If the histogram is a lesser value than the previous period it will be a lighter shade, and suggests the momentum is weakening.
When a shorter moving average (the 12 period) crosses the longer moving average (the 26 period) this suggests the trend is changing, as the more recent prices are rising faster than past prices.
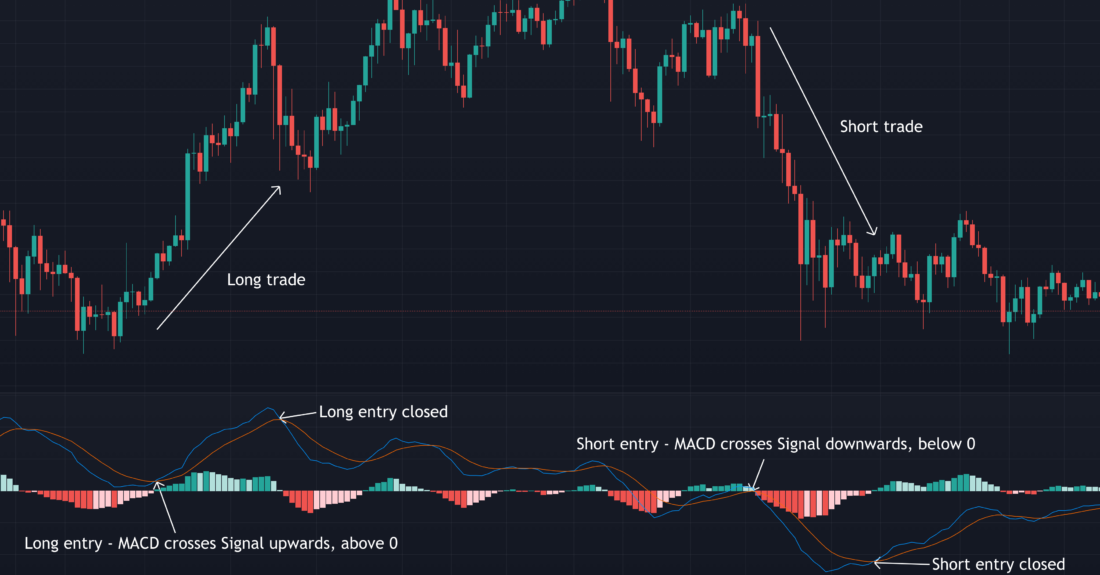
A basic way of trading using MACD is to enter a long trade when the MACD line crosses upwards the Signal line, whilst both are above zero. When the MACD crosses the Signal line downwards, the trade would then be closed.
If MACD crosses the Signal line downwards below zero, this could be an opportunity to enter a short trade. This would be closed when the MACD line crosses the Signal line upwards.

Disclaimer: Nothing within this article should be misconstrued as financial advice. The financial techniques described herein are for educational purposes only. Any financial positions you take on the market are at your own risk and own reward. If you need financial advice or further advice in general, it is recommended that you identify a relevantly qualified individual in your Jurisdiction who can advise you accordingly.


