- Industry New:
- Industry New:
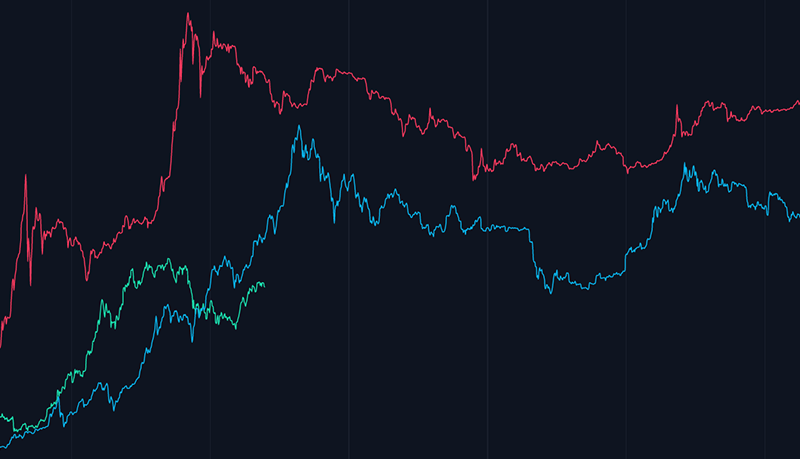
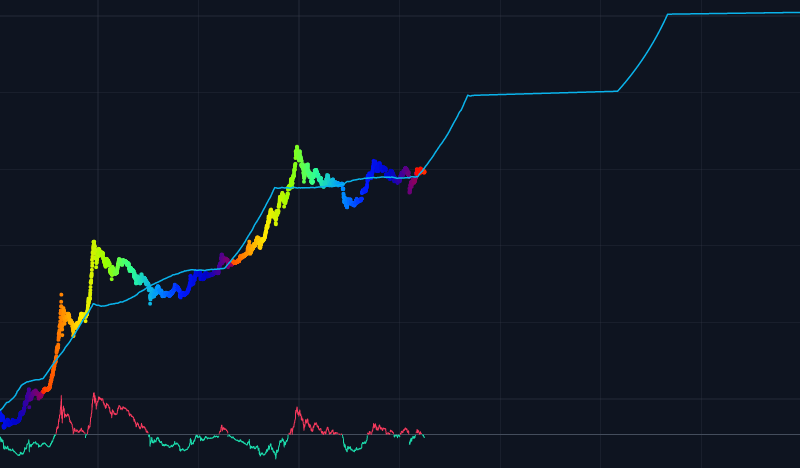
This chart looks at each of the 3 major Bitcoin cycles since their relative halving dates. Each line starts at the halving date and the x-axis runs...
- Industry New:
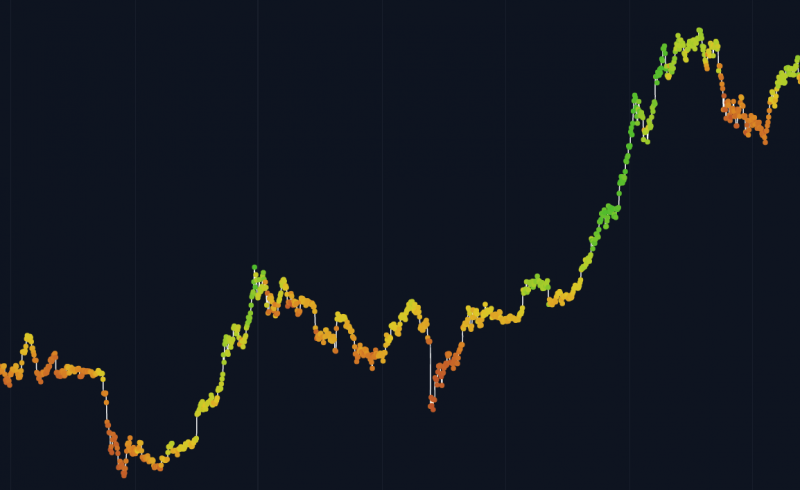
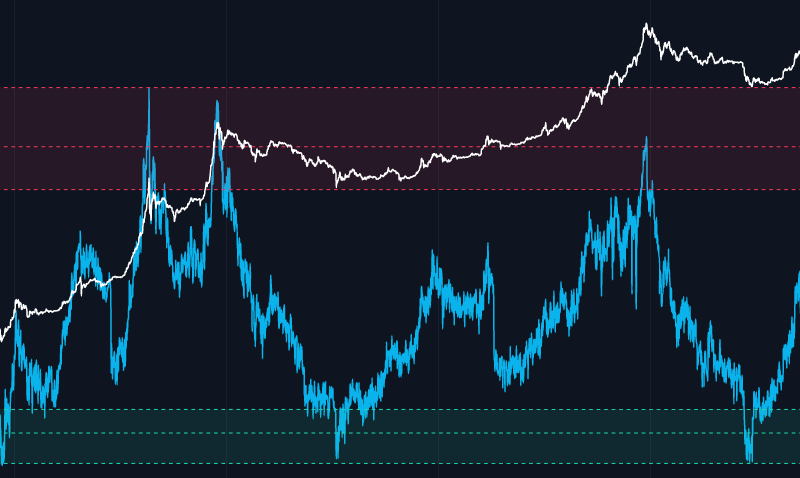
Indicator Overview Number of days in Bitcoin’s traded history where holding Bitcoin has been profitable relative to today’s price. This...
- Industry New:
- Industry New:
- Industry New:
- Industry New:
- Industry New:
- Industry New:
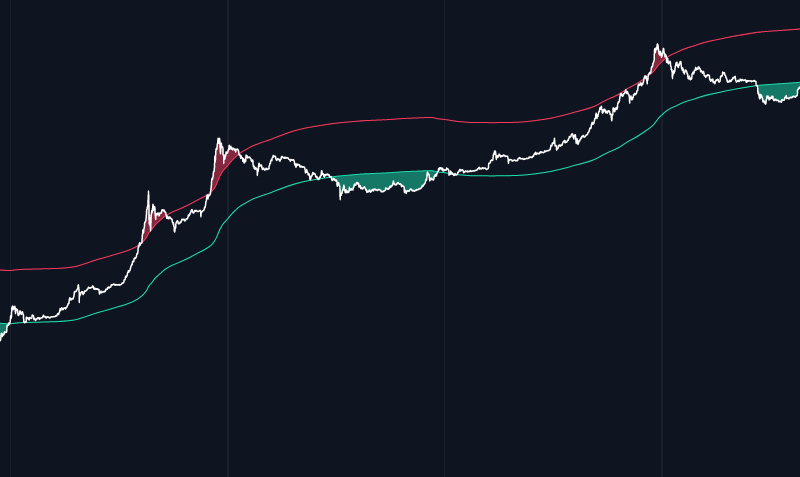
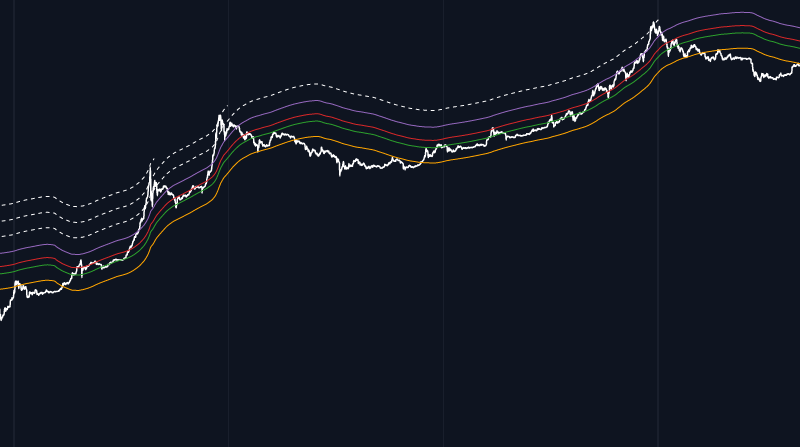
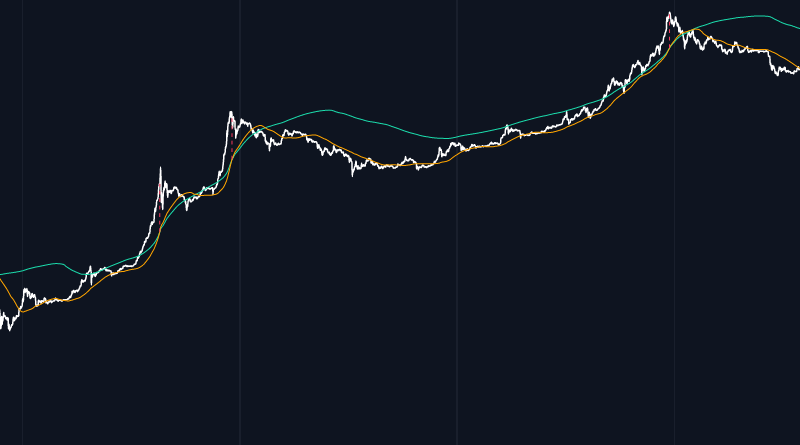
Indicator Overview The 2-Year MA Multiplier is intended to be used as a long term investment tool. It highlights periods where buying or selling...


