What is it and how to Interpret it
The Long/Short ratio is data which is available from several crypto exchanges offering futures markets to traders. In this article, we’re going to give an overview on all of the basics that you need to know about the long/short ratio: what it is, and how to take advantage of the data in your analysis.
What is the Long/Short ratio?
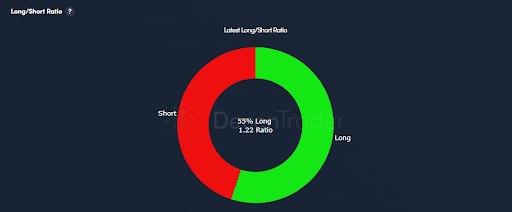
The Long/Short ratio for futures markets in the cryptocurrency market is data which tells us how many trading accounts are either holding net long or short positions for that particular asset and contract on the exchange in question.
The long short data is normally provided in a ratio form, which is simply; number of trading account long / number of trading account short. Alternatively it can be shown as a percentage.

Long/Short Ratio Analysis
LS Ratio analysis can be useful in understanding how market participants are behaving in a market. Typically, it is the relationship between the LS ratio and price which is to be taken note of, along with extremities in market conditions.
Relationship with Price.
“The herd is always wrong” is a generally accepted description of how market participants behave in financial markets, whereby the majority of retail traders will make the wrong decisions at the worst time.
As a result, it is possible to identify this behaviour if we analyse the relationship between price and the LS ratio in order to help us determine if the “herd” are pushing in the wrong direction, against the price action.
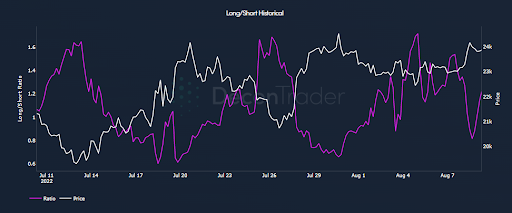
An example is below, here we can observe a near perfect inverse relationship between Price and the LS ratio. As the Price increases, we can see that the LS ratio is falling, showing that as price is increasing, the majority of traders and betting against the market, and when the price decreases, the majority of traders are betting into the market.

To have had an edge and to be ahead of the market, it would be important here to identify where the “herd” start pushing the wrong direction against the price.
Once price begins to fall, the “herd” begin to long the market when they should have been taking profit, which generally continues until the “herd” are forced to to close their positions via stop losses, liquidations or out of fear. As Price begins to rise, the “herd” are selling positions into the institutions / pro traders who drive the market up. In this example, the Herd are providing liquidity to the institutions / pro traders.
Can the “Herd” be right?
It is important to note that it is the relationship between price and the LS ratio; It is possible for example, for the LS ratio to generally rise as price rises which is often the case in the latter stages of a bull market. If the price is increasing and the majority are betting on price continuing higher, this may indicate that a top is coming, if an extremity in the LS ratio has been reached.
So it is important to consider both the extremity of the market positioning alongside how it is reacting with price.
The Decentrader FOILS indicator which determines a bullish, bearish or neutral outcome for price specifically looks at where there is a deviation between the change in the price and the ratio.
If price increases and the LS ratio increases; neutral.
If price increases and the LS ratio decreases; bullish.
If price decreases and the LS ratio decreases; neutral.
If price decreases and the LS ratio increases; bearish.
Conclusion
After reading this article, you should now have a basic understanding of the Long/Short ratio data for Crypto futures markets. We also took a look at some of the benefits of how to analyse the relationship between price and the LS ratio and why an inverse correlation can be used to help find an edge in decision marking in the market.
Disclaimer: Nothing within this article should be misconstrued as financial advice. The financial techniques described herein are for educational purposes only. Any financial positions you take on the market are at your own risk and own reward. If you need financial advice or further advice in general, it is recommended that you identify a relevantly qualified individual in your Jurisdiction who can advise you accordingly.


