Bitcoin Update in the Context of War
Earlier today Russia began its invasion of Ukraine. Markets have unsurprisingly reacted negatively to this news, and Bitcoin is no exception.
Today’s sharp down move followed an already negative few days once $BTC lost the range between $41,000 – $44,200. Failure to hold and breakthrough that important technical level highlighted that the bears remained in control. Price has continued to drop since.
A warning sign earlier in the week was the Long / Shorts ratio going parabolic as $BTC price dropped. Suggesting that many traders were attempting to buy the dip unsuccessfully.
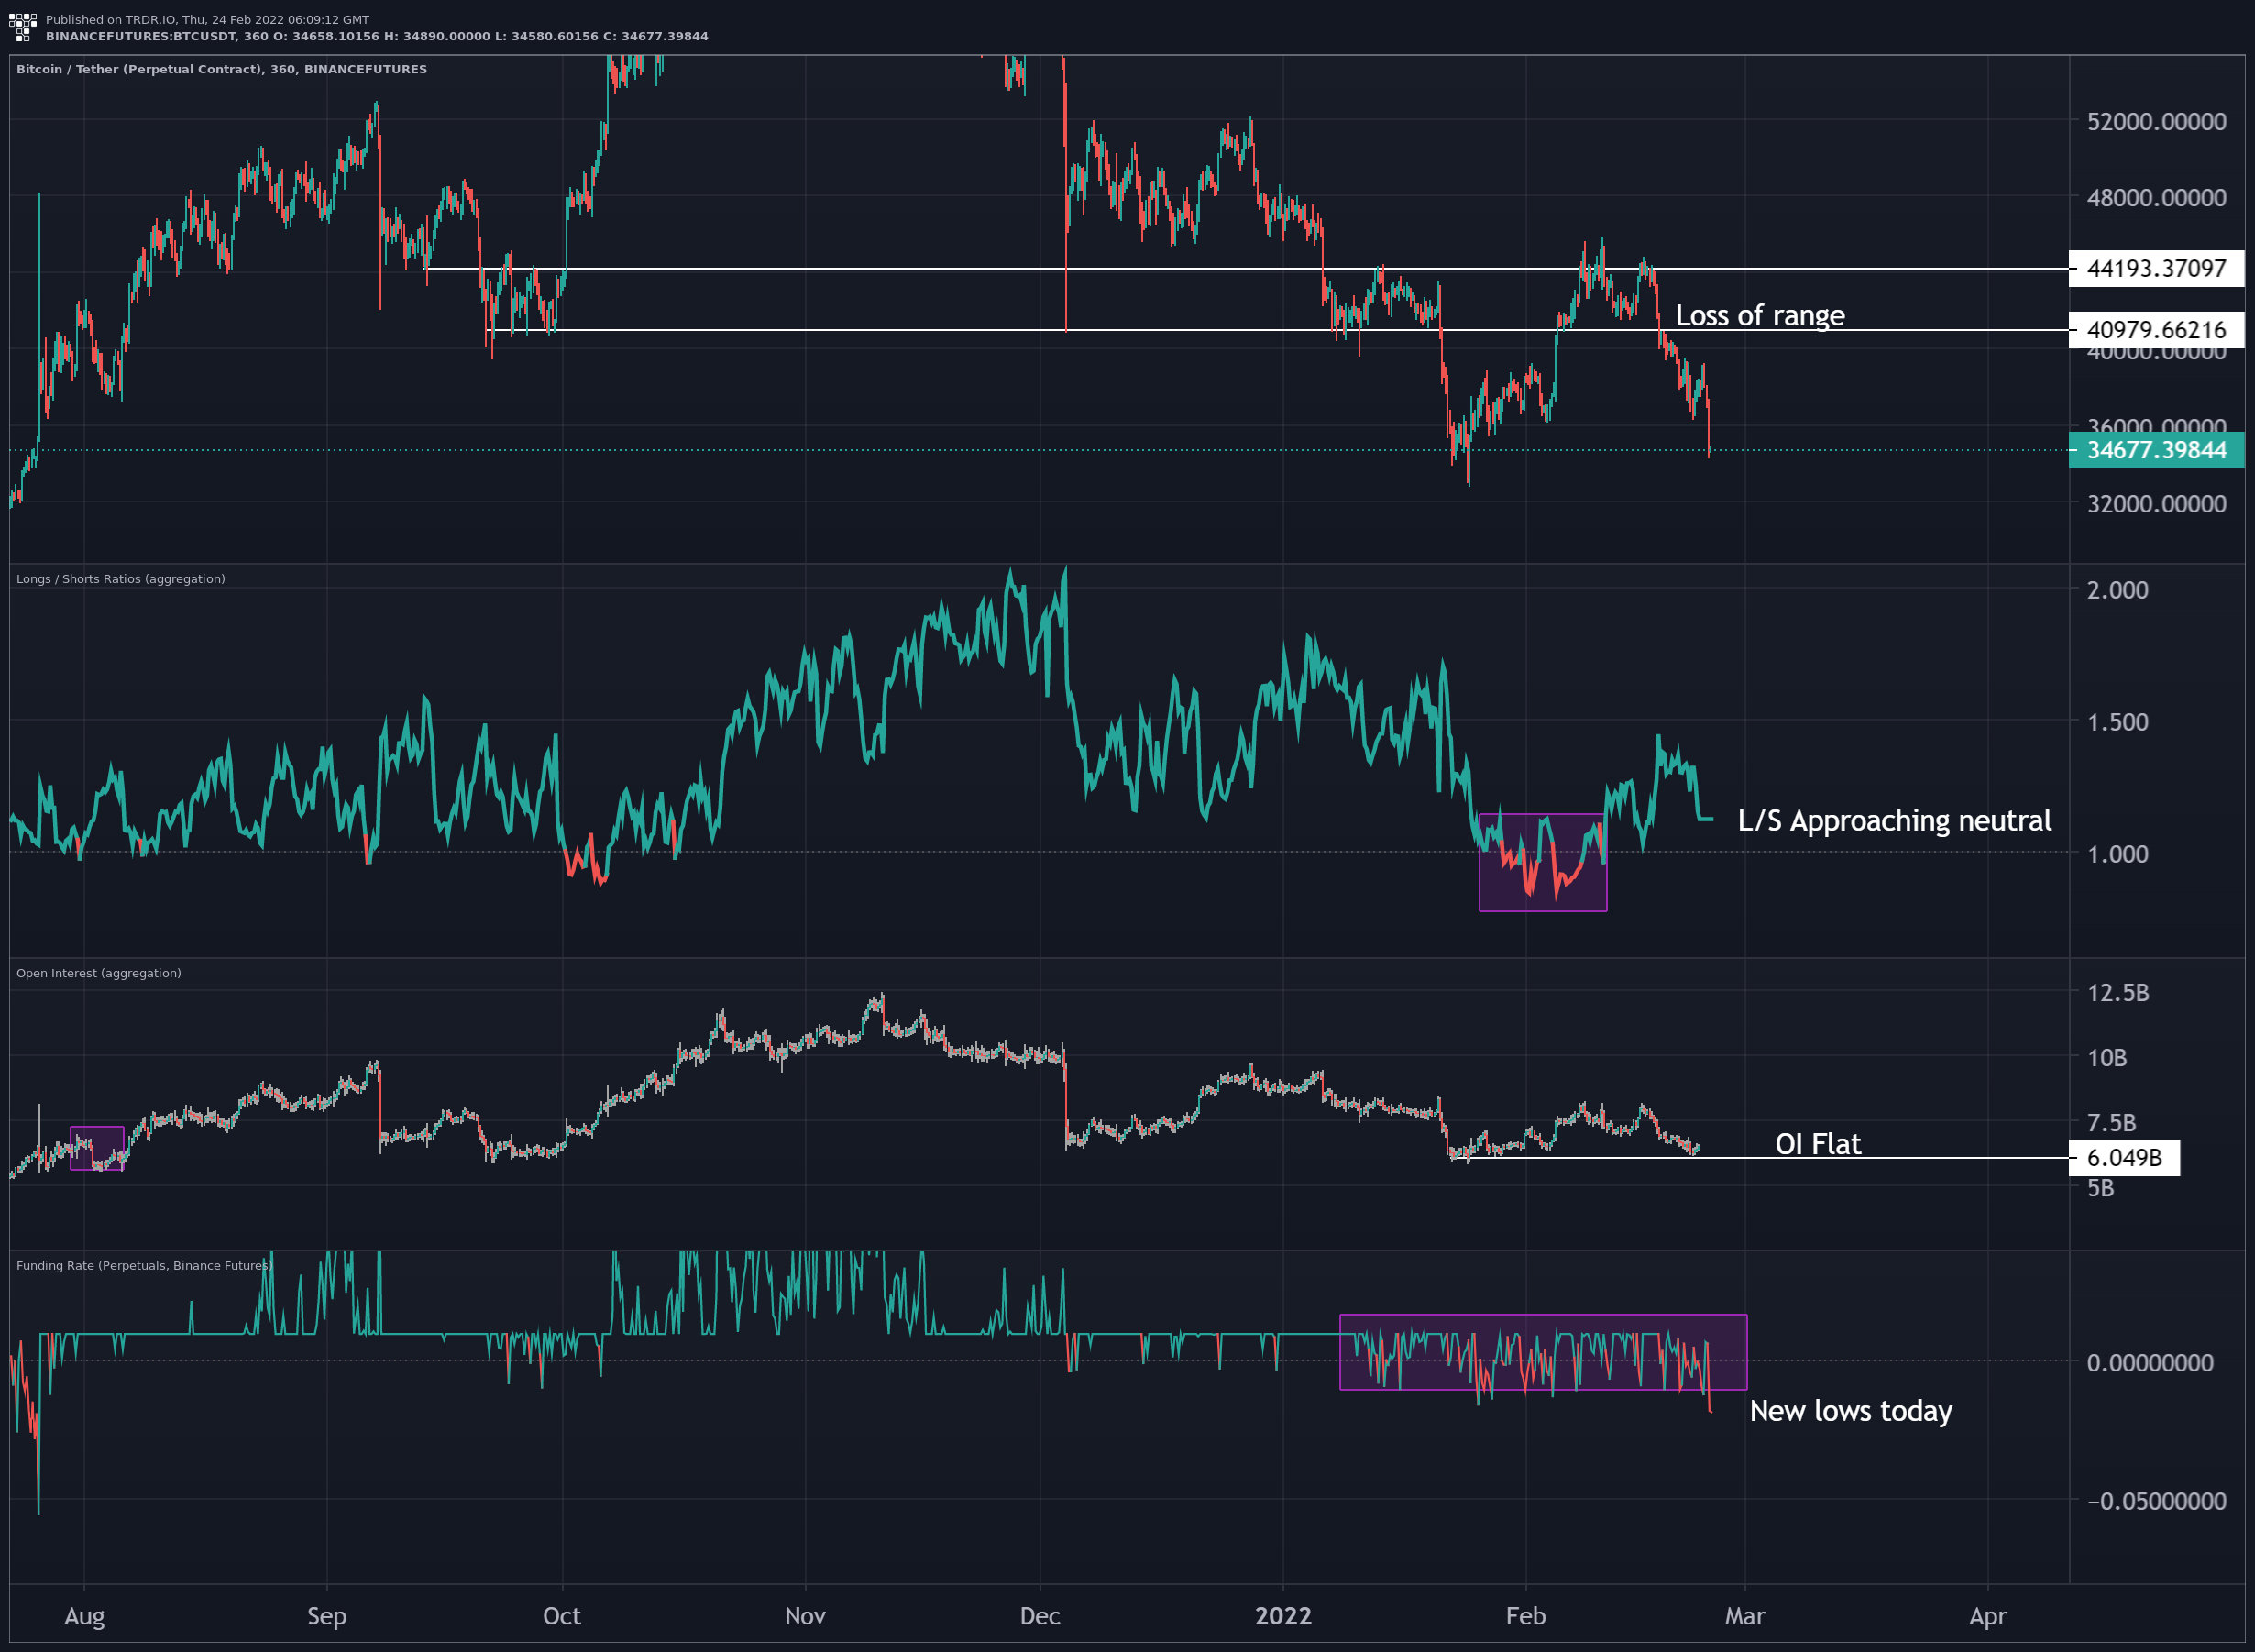
Figure 1: Price dropped as L / S ratio climbed, but L/S ratio is now resetting.
The Longs/Shorts ratio has now reset to a more neutral level, and on this sharp price drop today, funding is firmly negative and making new near-term lows on the Binance Futures contracts.
Predator signaling bearish across timeframes
Not surprisingly, with this recent acceleration of the downtrend, Predator is now bearish across all timeframes. Highlighting that caution is advised in the near term at least until we start to see some evidence of a change in trend.
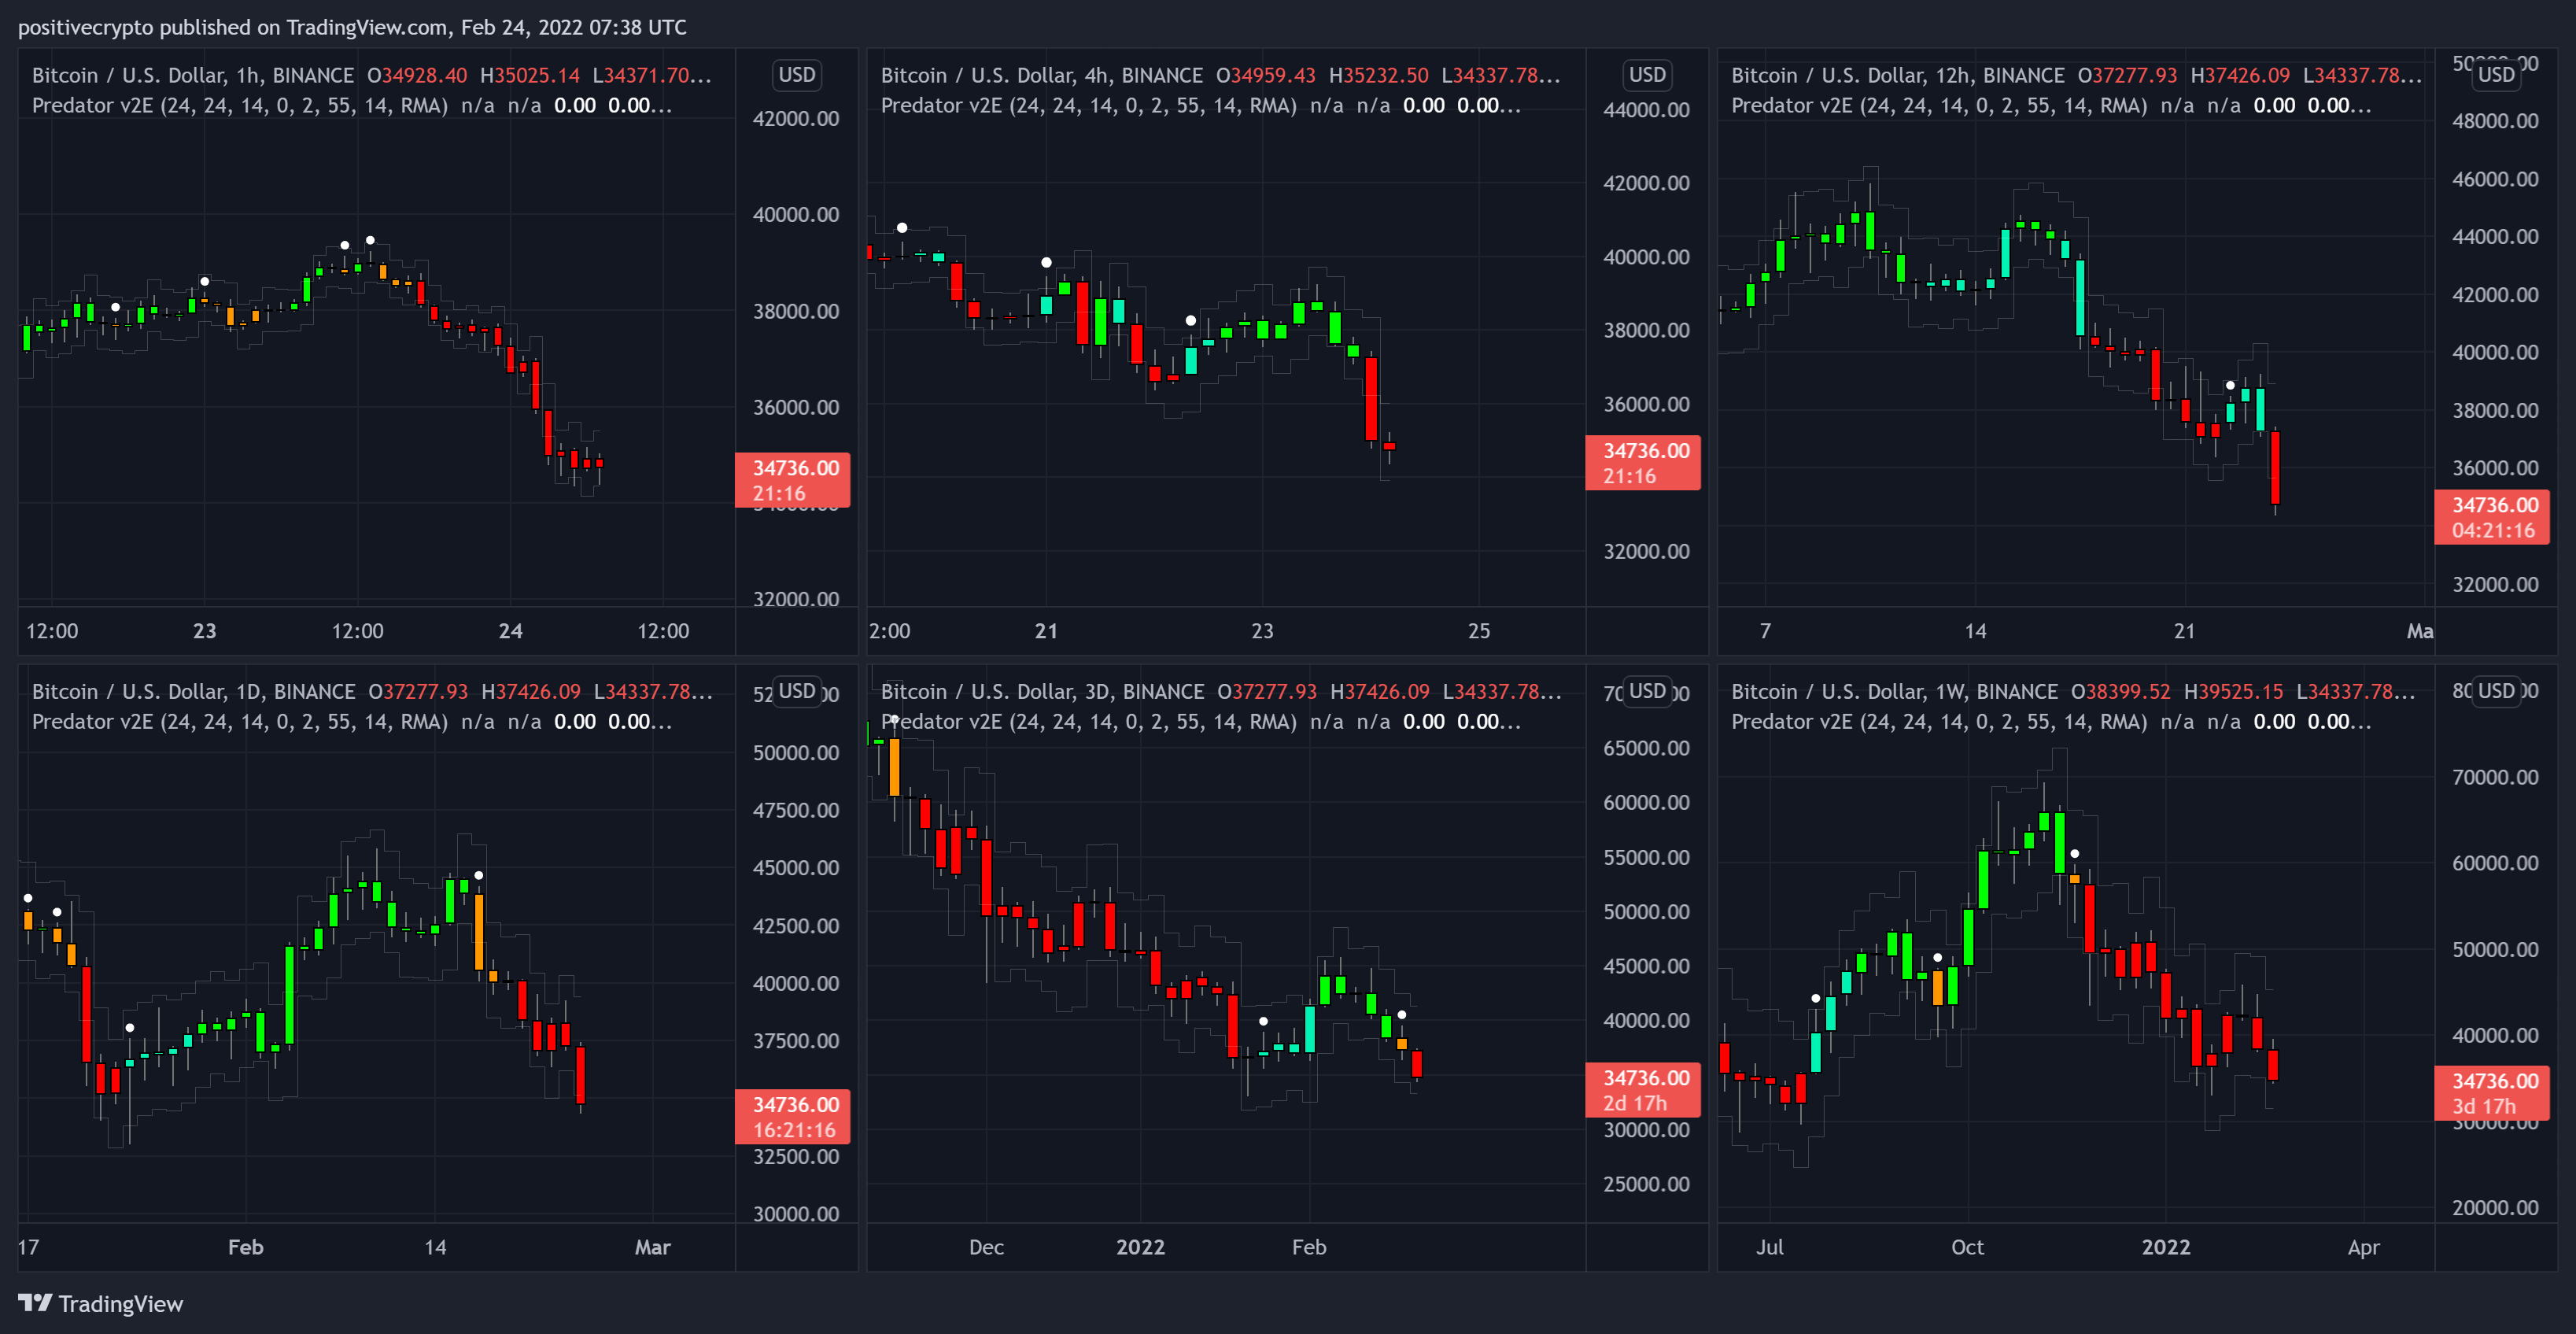
Figure 2: Predator bearish across ALL timeframes at the time of writing.
Downside Risk
Should price continue to drop, the 20WMA Deviation bands highlight a zone of potential support for Bitcoin between $29,382 and $25,253. The last time price deviated that far away from the 20WMA was during the March 2020 covid crash – though we came very close in the summer 2021 crash also.
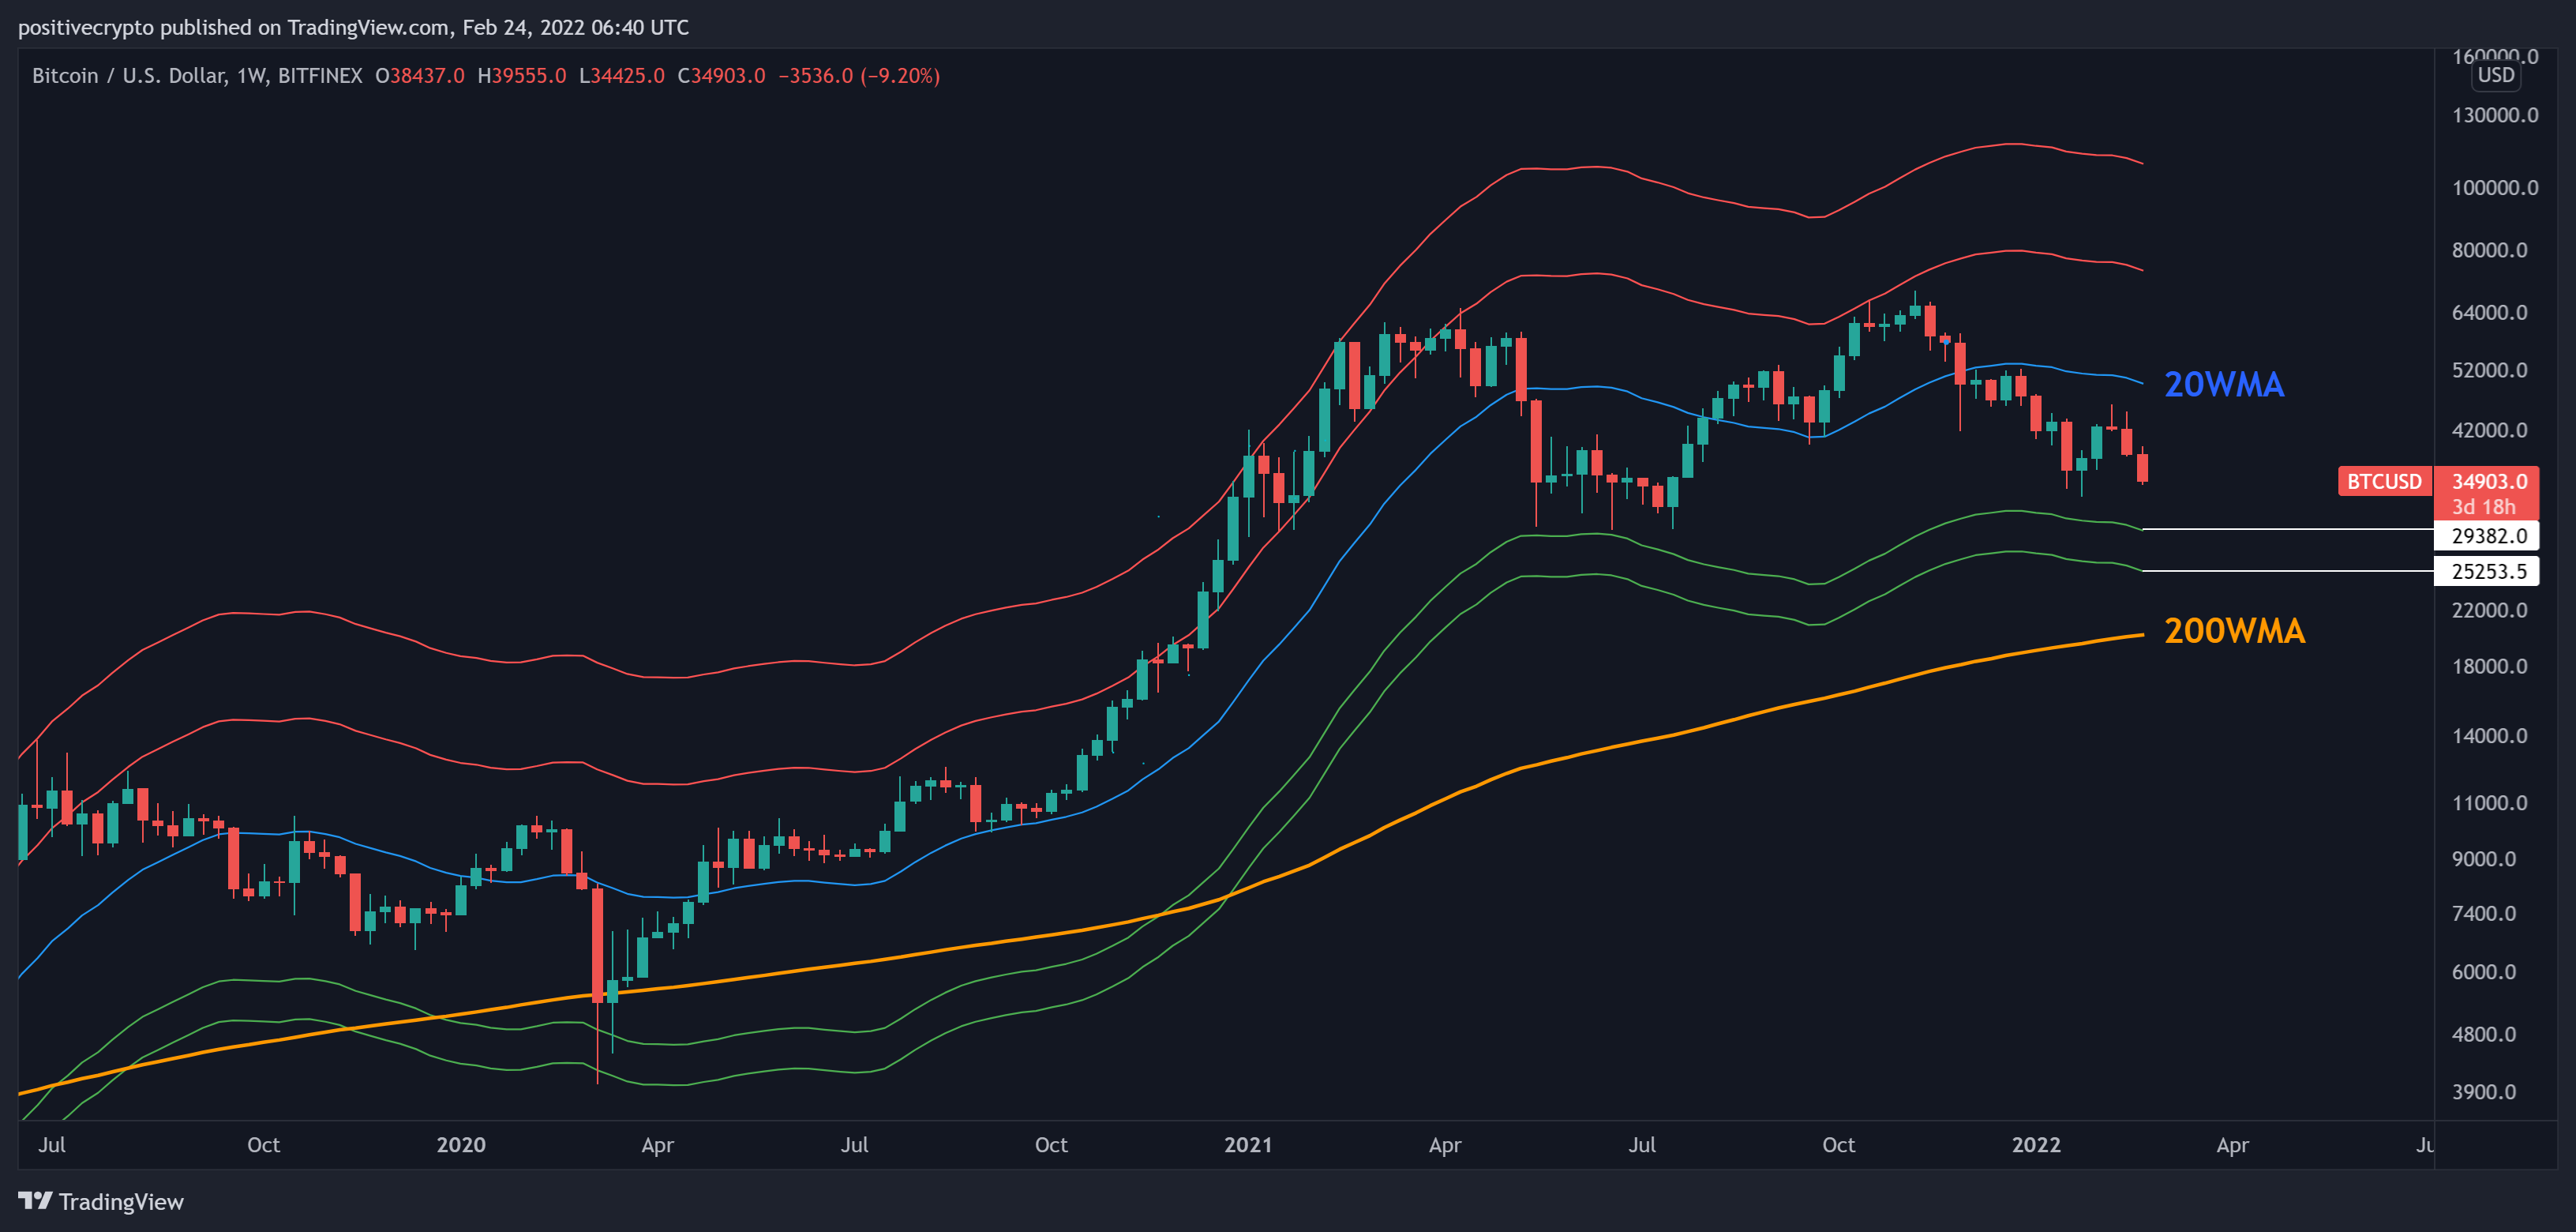
Figure 3: $BTC price now approaching the 20WMA Deviation bands.
Should price fall below those levels then the final major support is the 200WMA which has acted as support throughout the bear markets and crashes of Bitcoin’s history. The 200WMA is currently at $20k and rising.
Log Growth Curve
Zooming out and looking at the macro picture, price continues to make its way through the logarithmic growth curve. Recent price action is now moving towards its lower boundary.
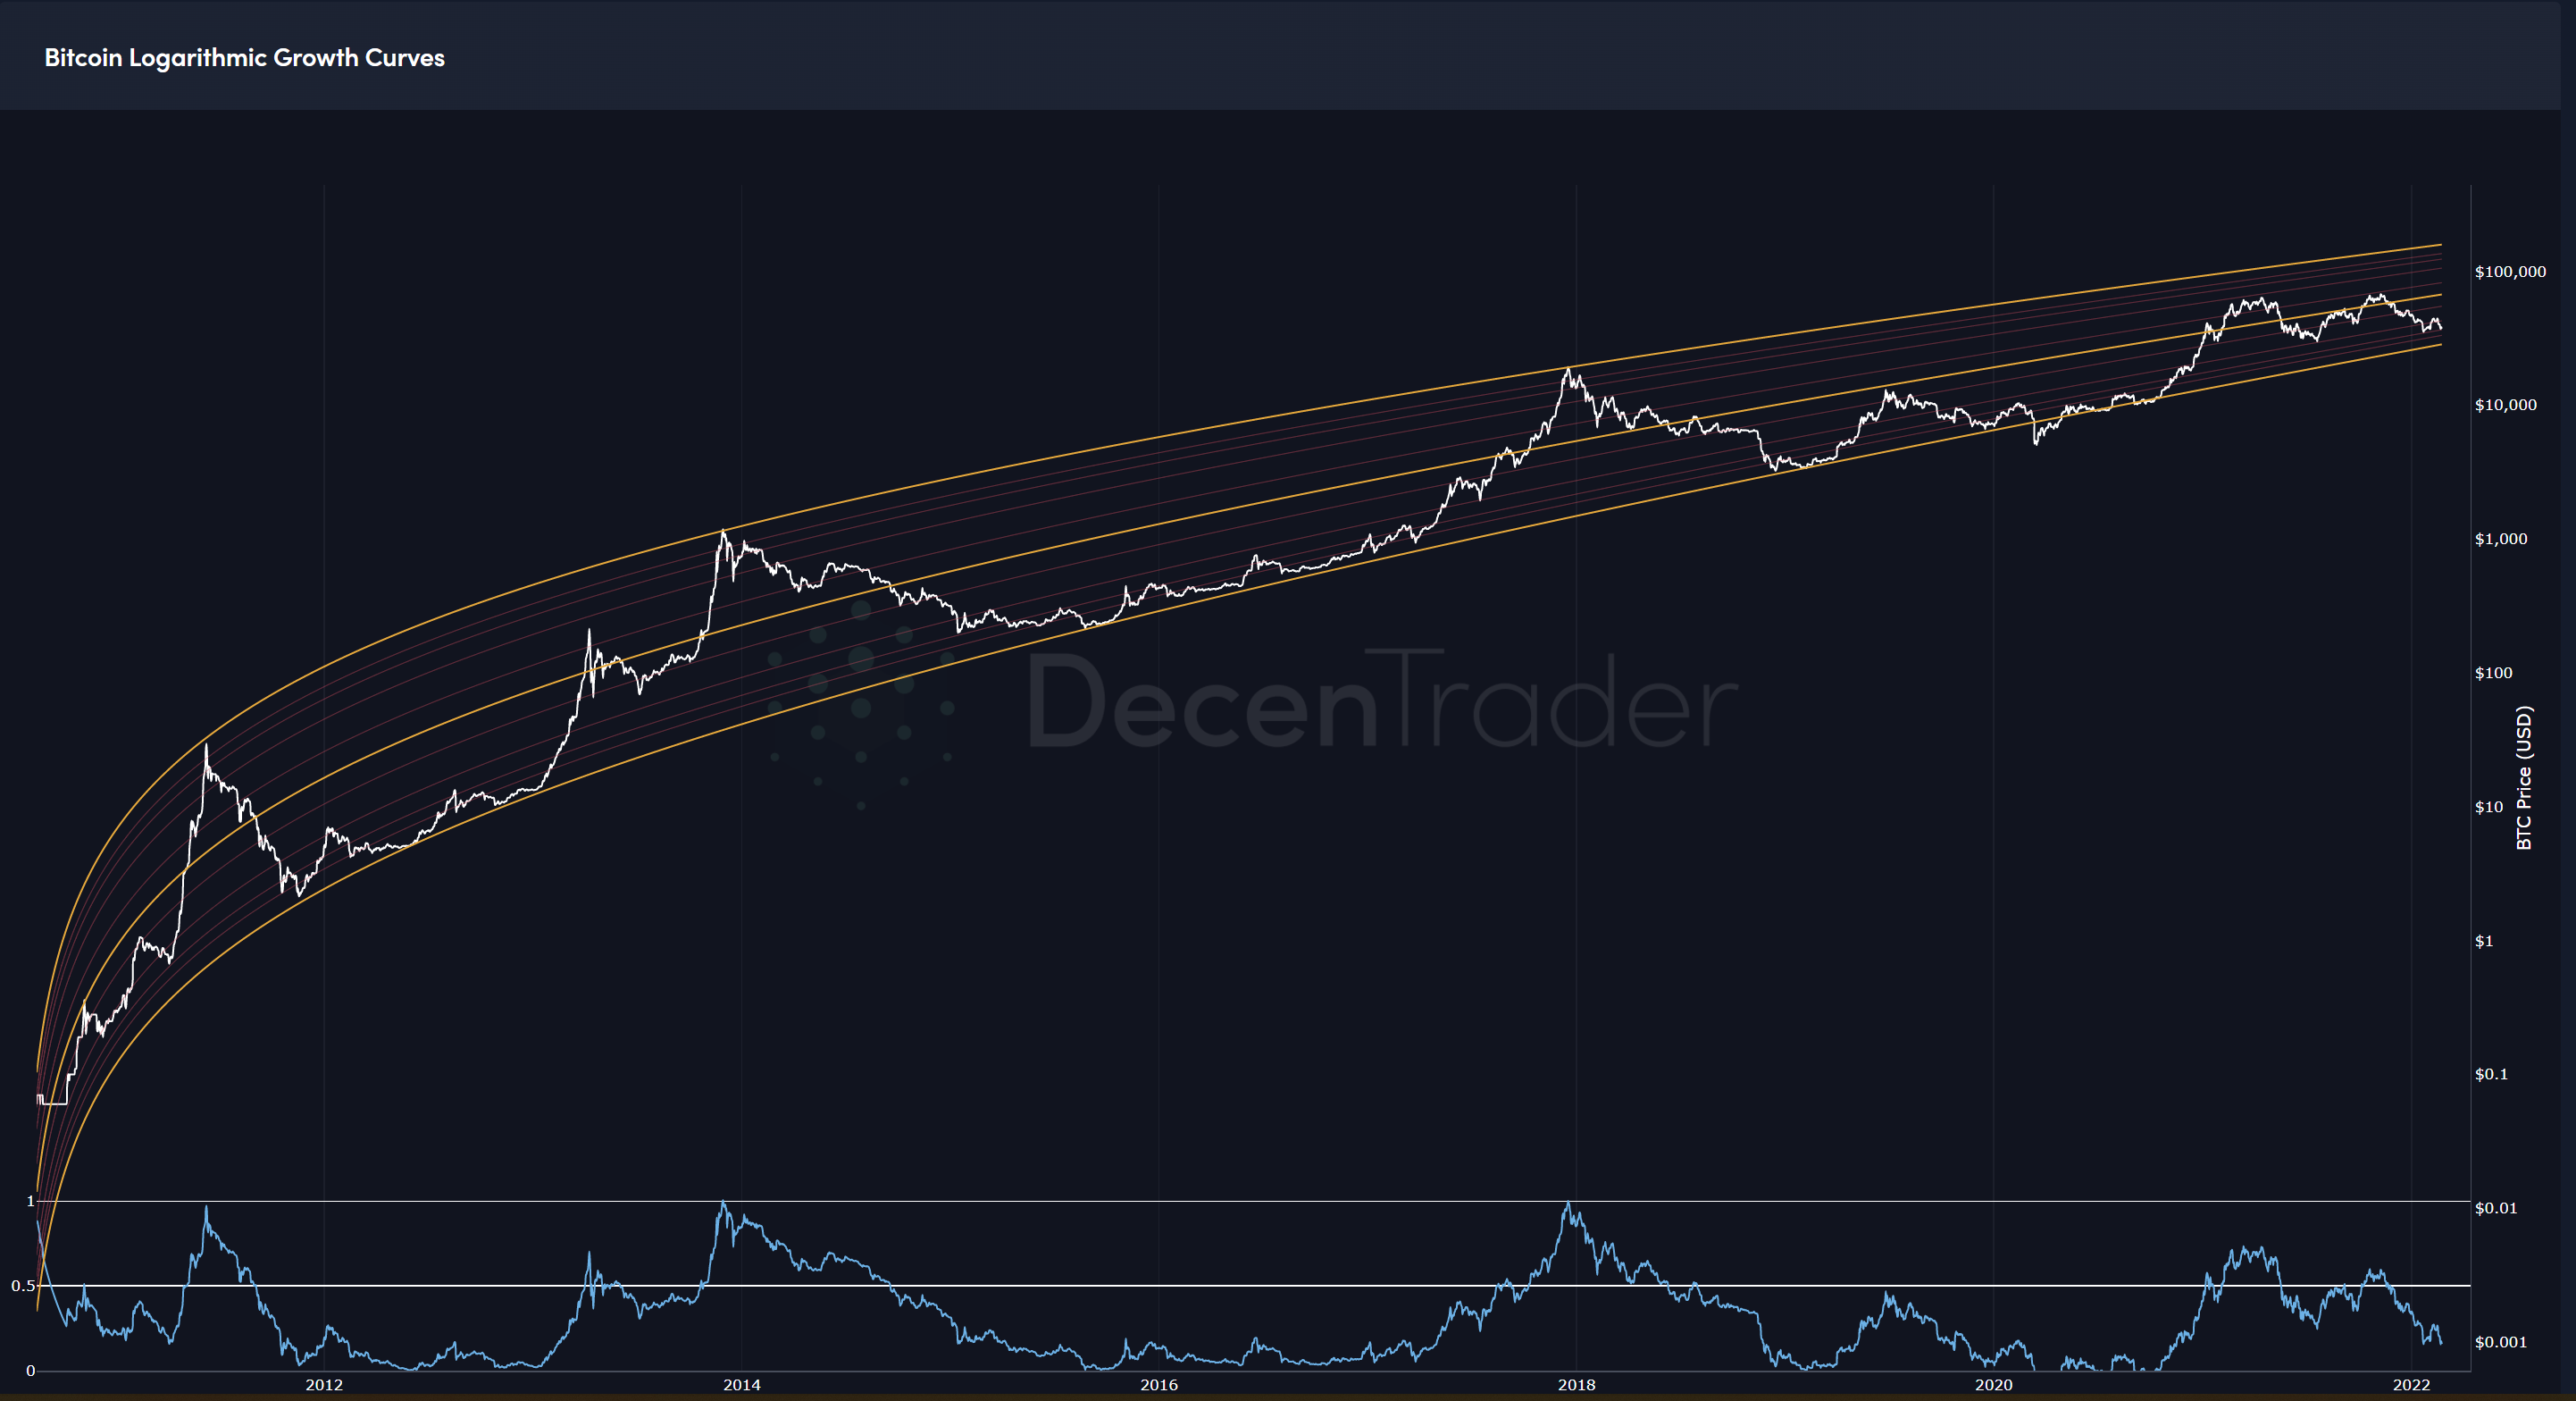
Figure 4: Bitcoin Logarithmic Growth Curve.
The lower boundary of the curve is currently at $29,283, 15% below current prices:
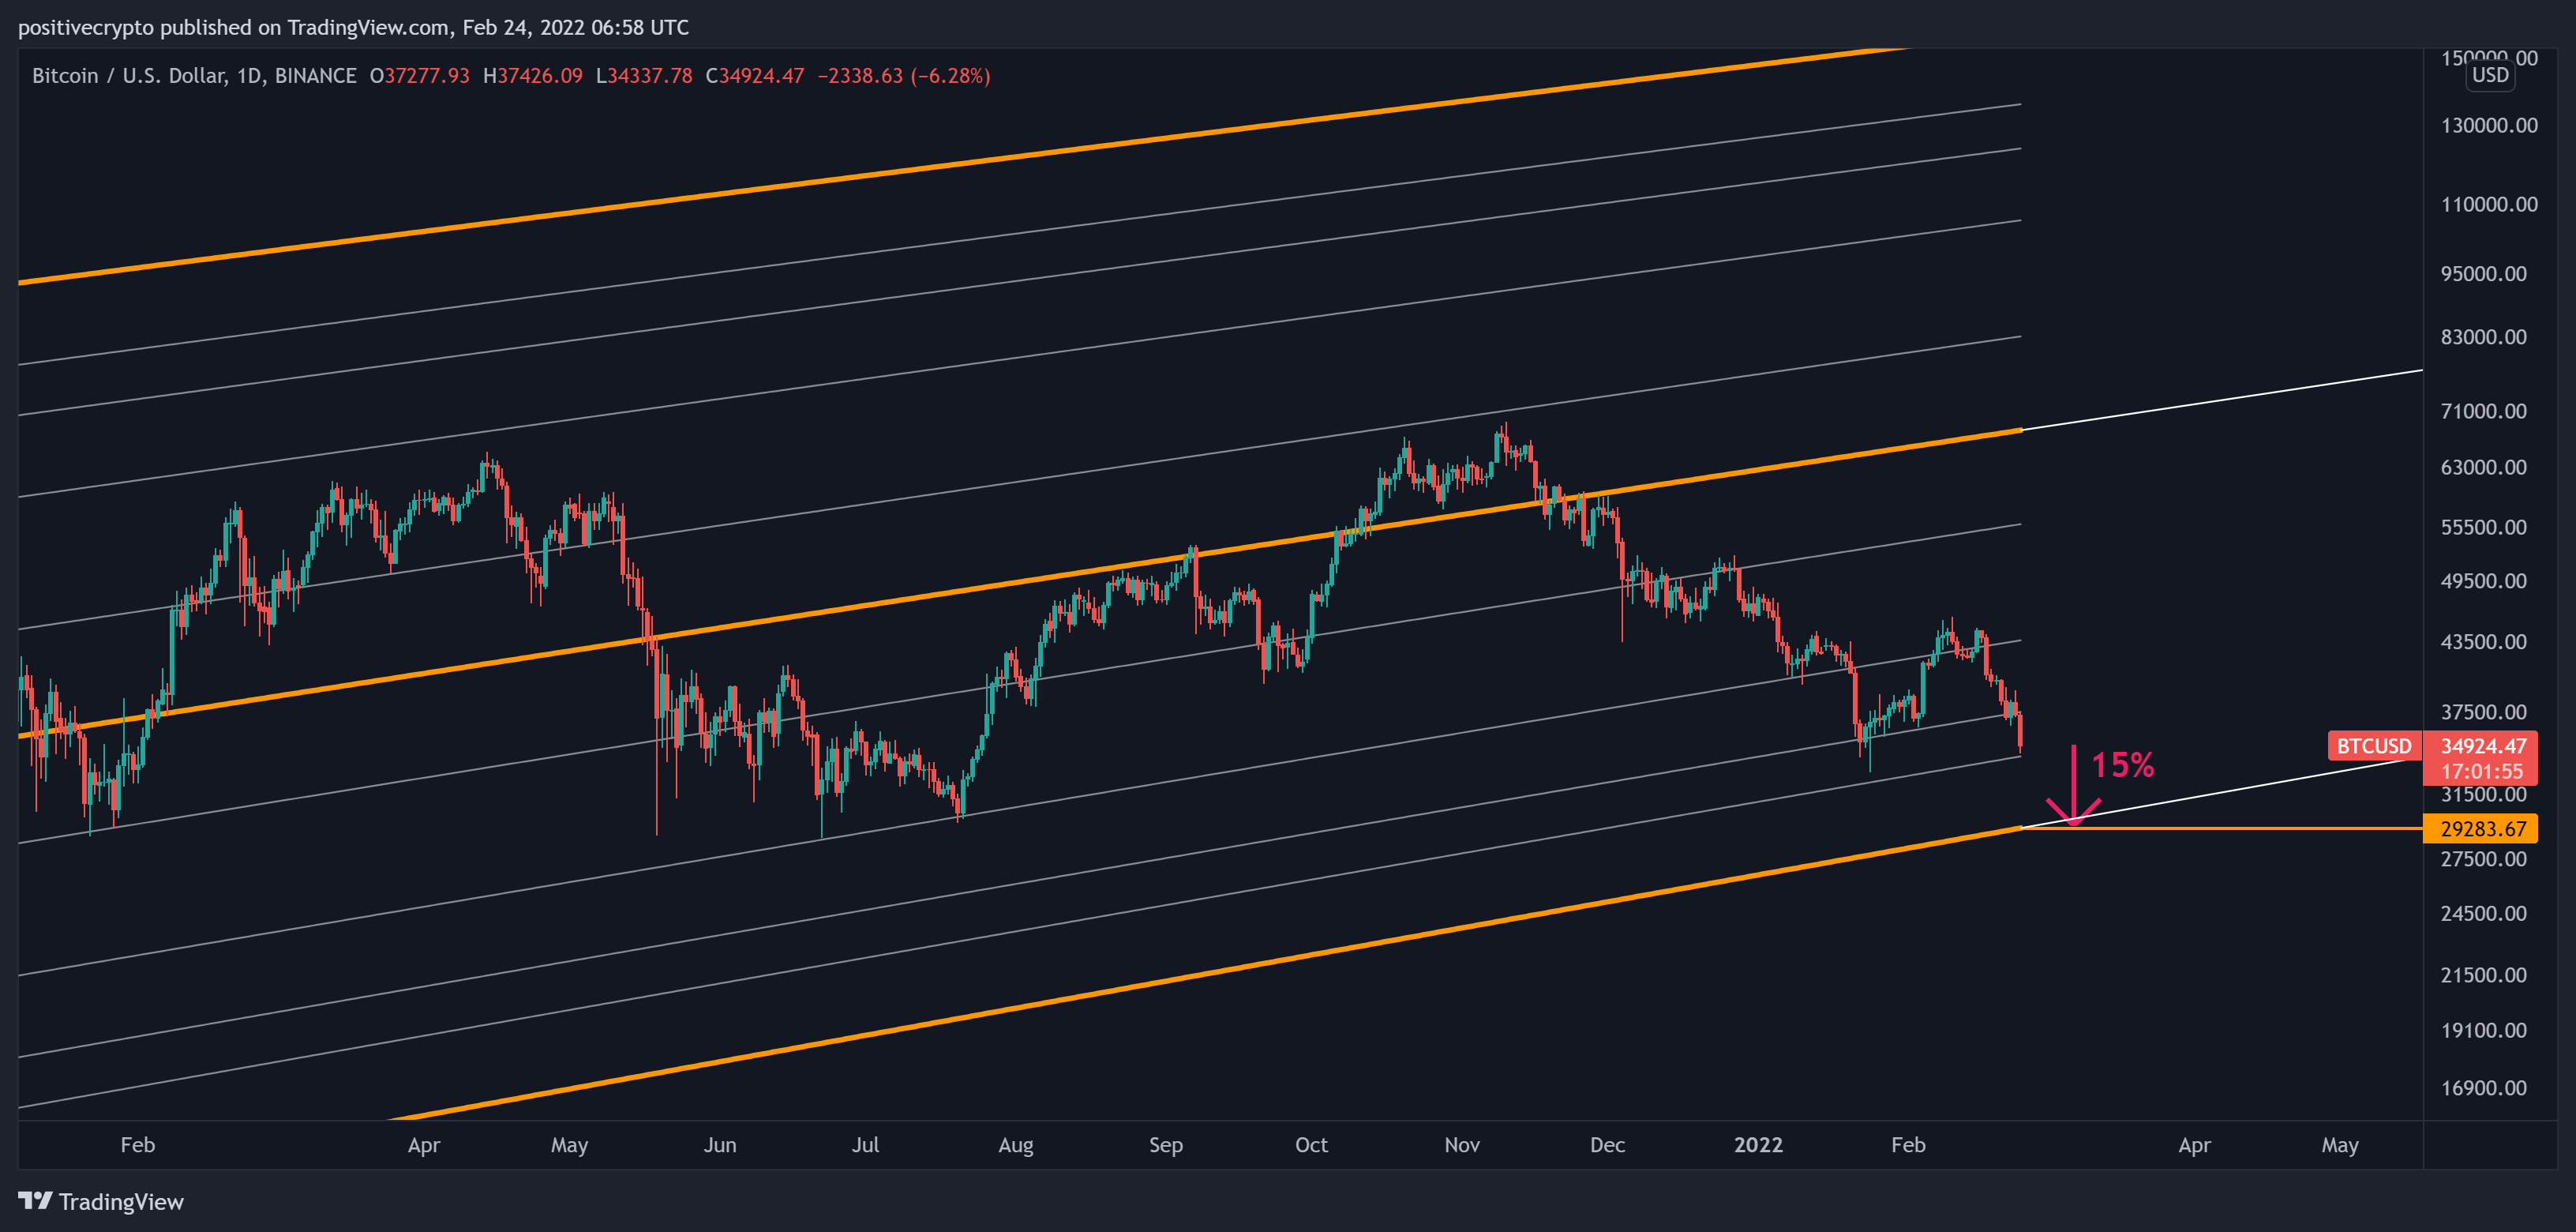
Figure 5: A zoomed-in view of the Logarithmic Growth Curve.
These targets also broadly line up with Moonraker key support levels at $32,500 and $29,500:
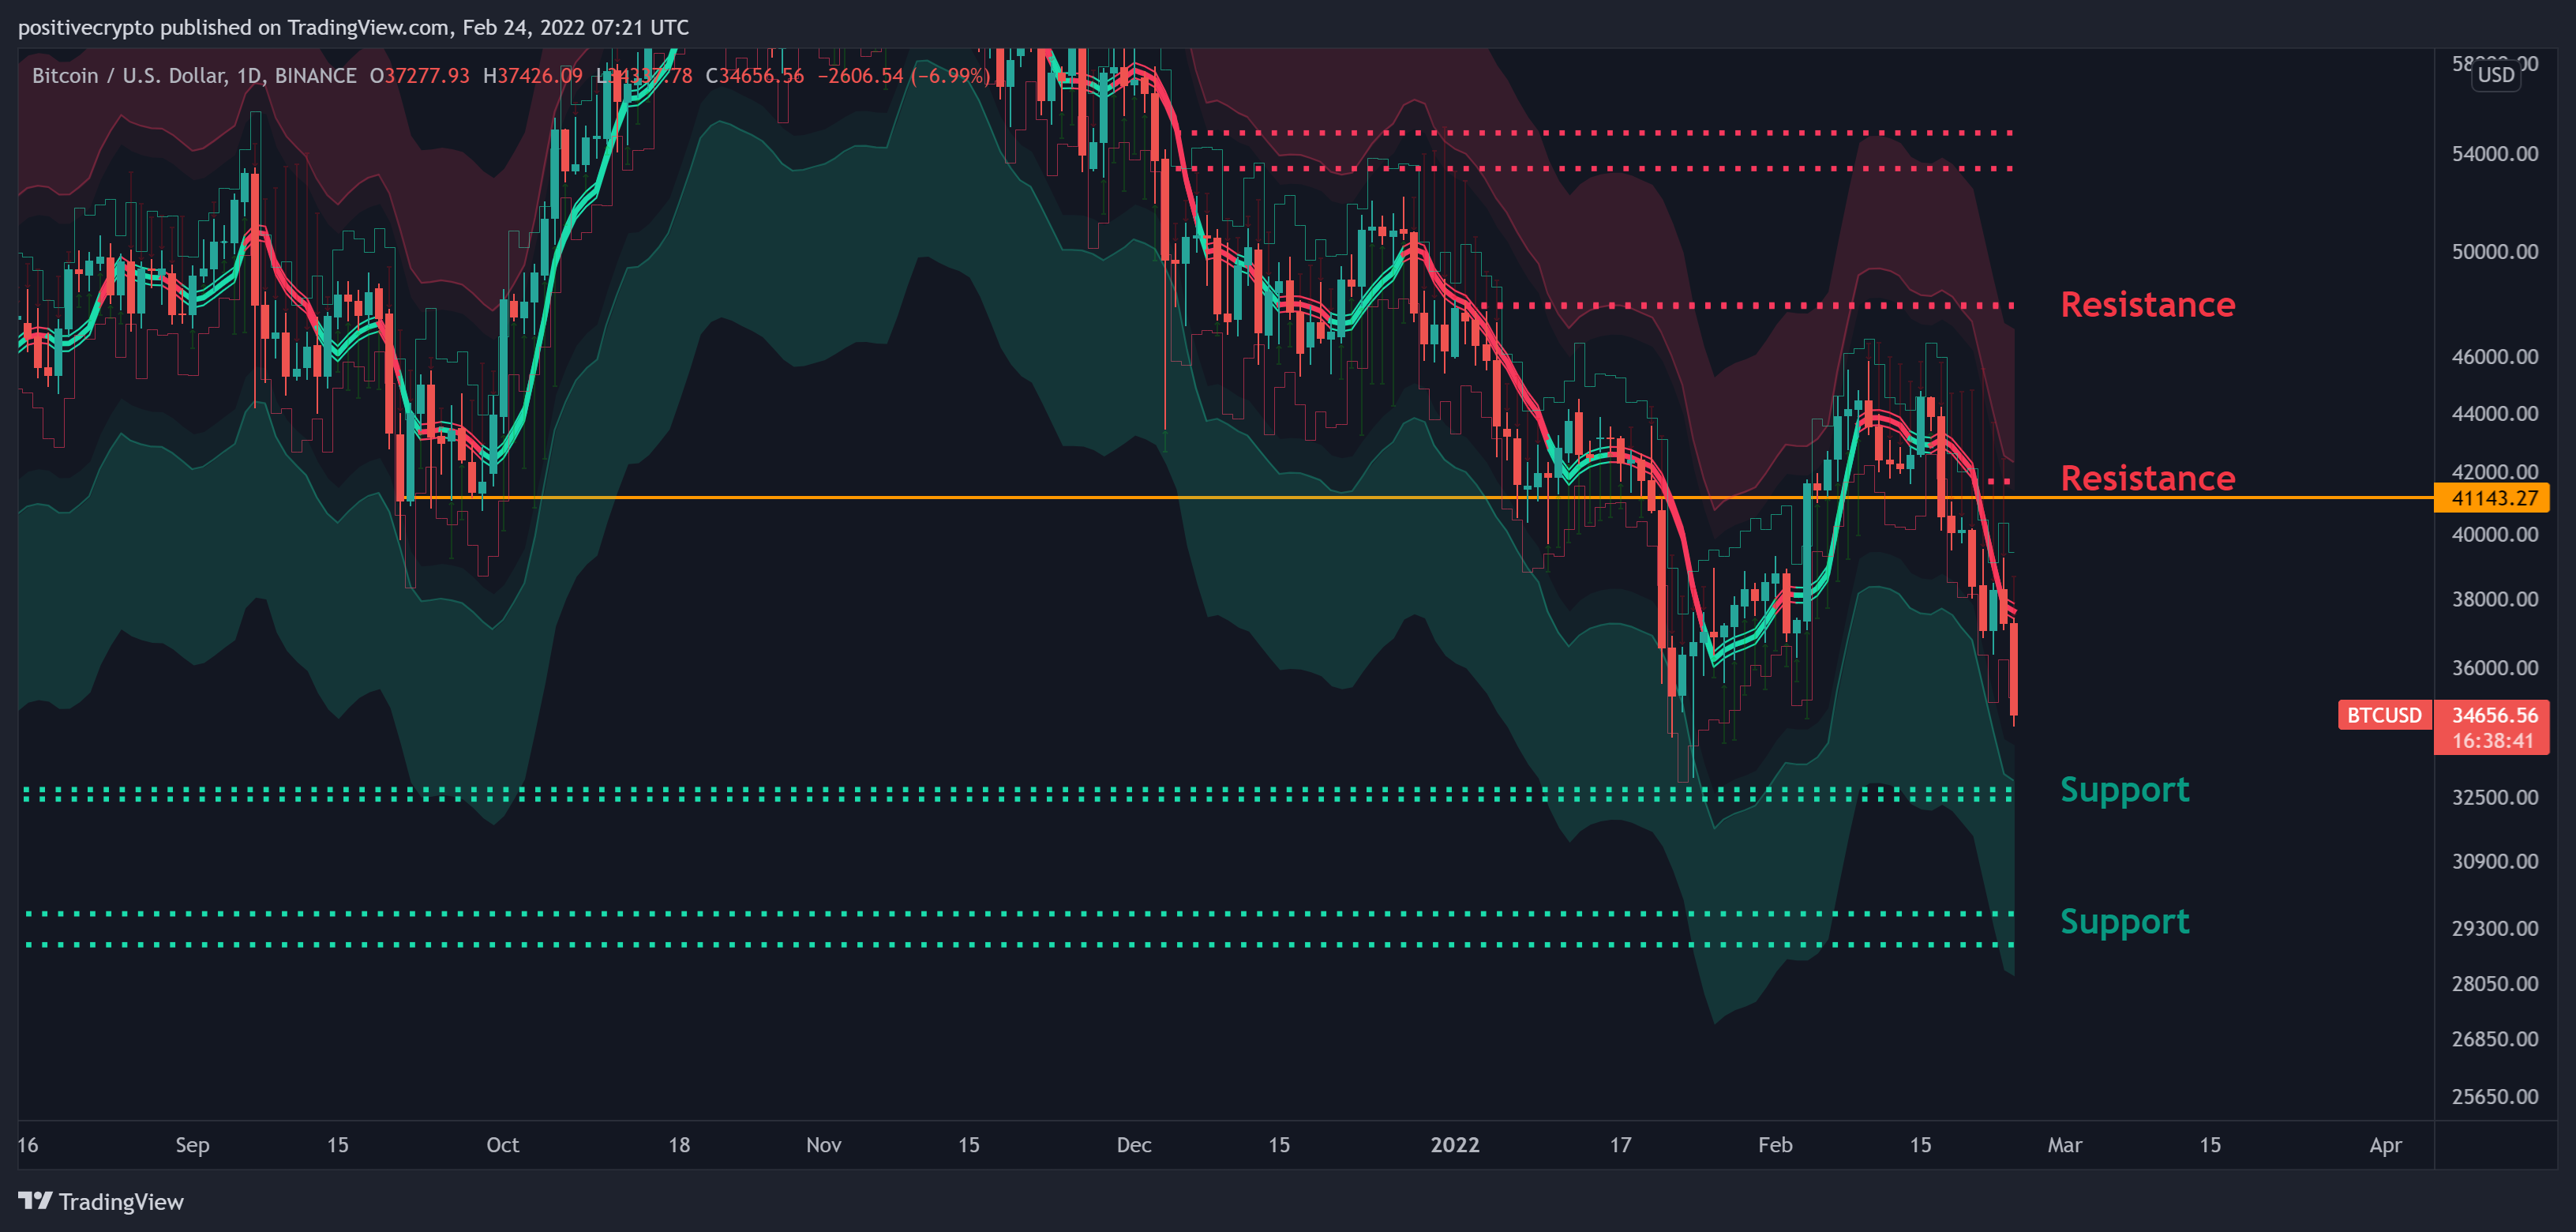
Figure 6: Moonraker key levels.
Should Bitcoin be able to bounce then its first challenge will be to reclaim the Moonraker mean reversion at $37,500, before the next key resistance at $41,100.
During times of uncertainty such as this, it pays to be very clear on your strategy. For traders, having clear invalidation levels and strong risk management will allow you to survive. For longer-term investors, we are approaching historical major support levels, and anywhere in this region is likely to be a good place to dollar-cost-average over the coming weeks.
Stay safe!
Disclaimer: Nothing within this article should be misconstrued as financial advice. The financial techniques described herein are for educational purposes only. Any financial positions you take on the market are at your own risk and own reward. If you need financial advice or further advice in general, it is recommended that you identify a relevantly qualified individual in your Jurisdiction who can advise you accordingly.


