Bitcoin Good Times Continue…
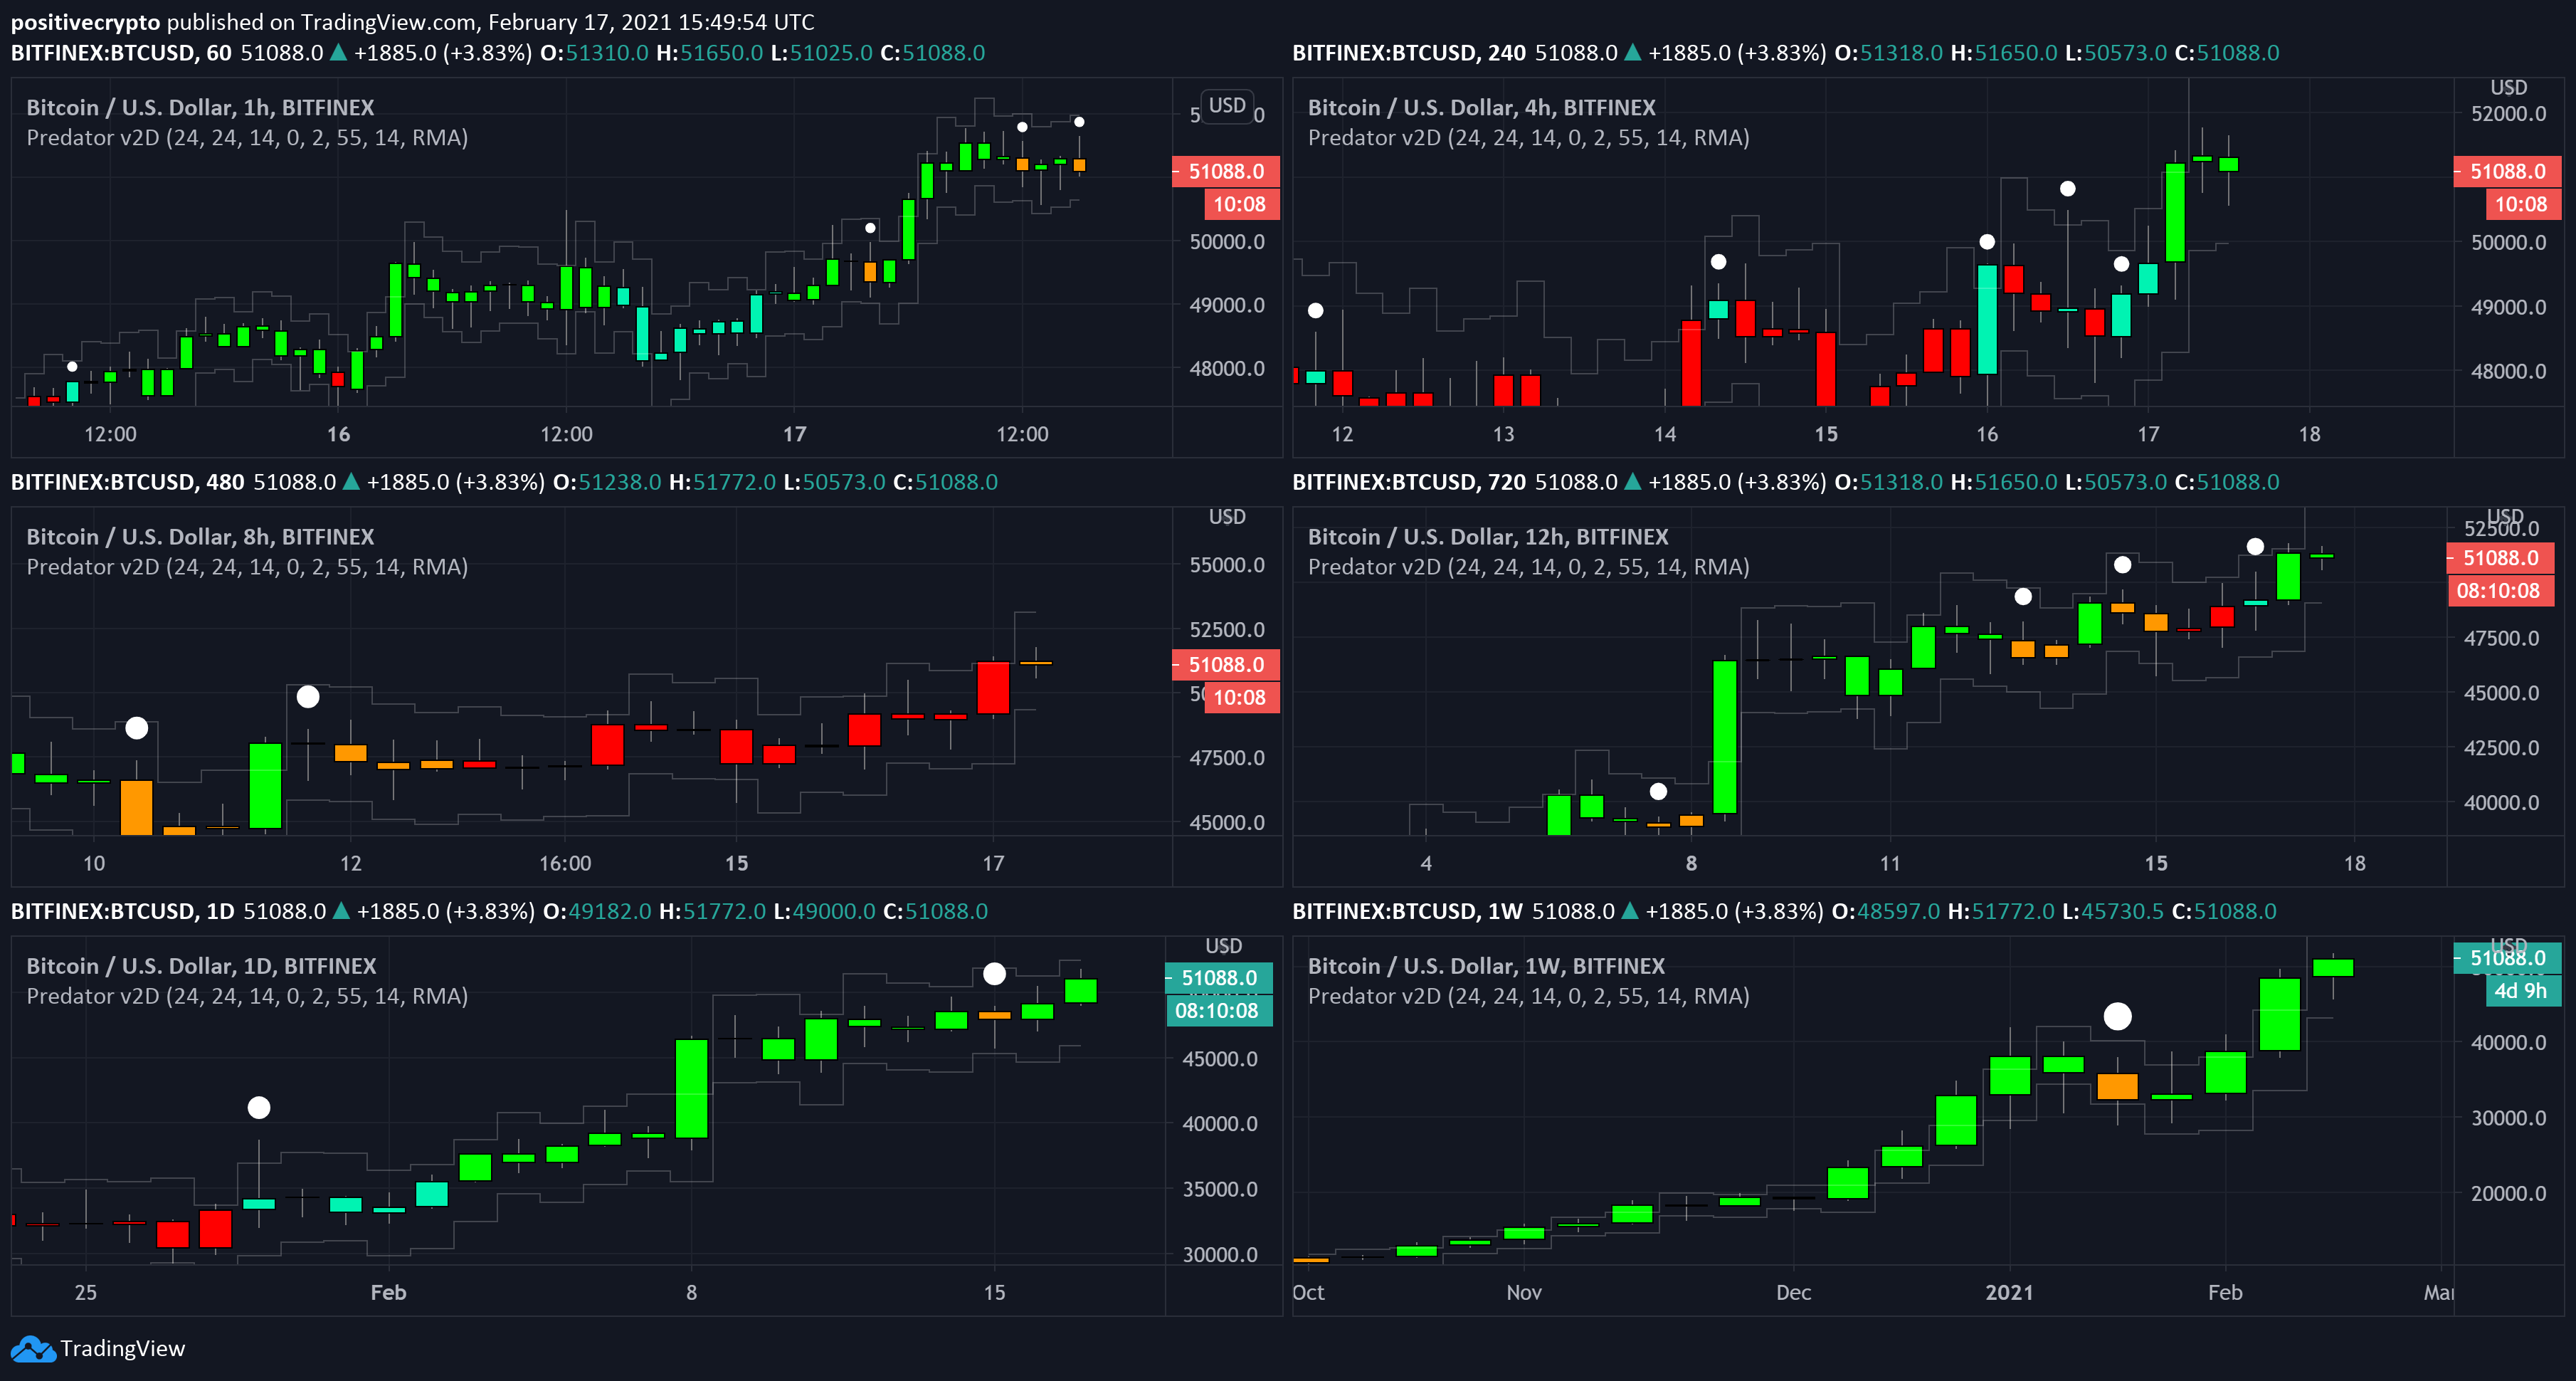
Bitcoin convincingly broke above $50k today and continues to look strong across timeframes. Fundamental good news just keeps on coming as Microstrategy announced today a convertible bond offering that will allow them to put even more bitcoin on their balance sheet. Michael Saylor just cannot resist!
Technically, as well as breaking above $50k, $BTC has now broken above the 0.786 fib extension level which was acting as resistance for the past few days.

Price Targets
First target remains the next fib level at $54,000 which may prove to be the next point of resistance. Beyond that, assuming a strong bid continues as new participants scramble to enter the space…which is likely, then it is possible we see price reach the 1.618 fib level. That provides a target of $70,000 in the coming weeks.
Predator
The Predator Indicator is currently looking bullish (green) across several key timeframes (4hr, 12hr, Daily, Weekly) which suggests we are likely to continue trending up in the near term.

Bitcoin Held On Exchanges
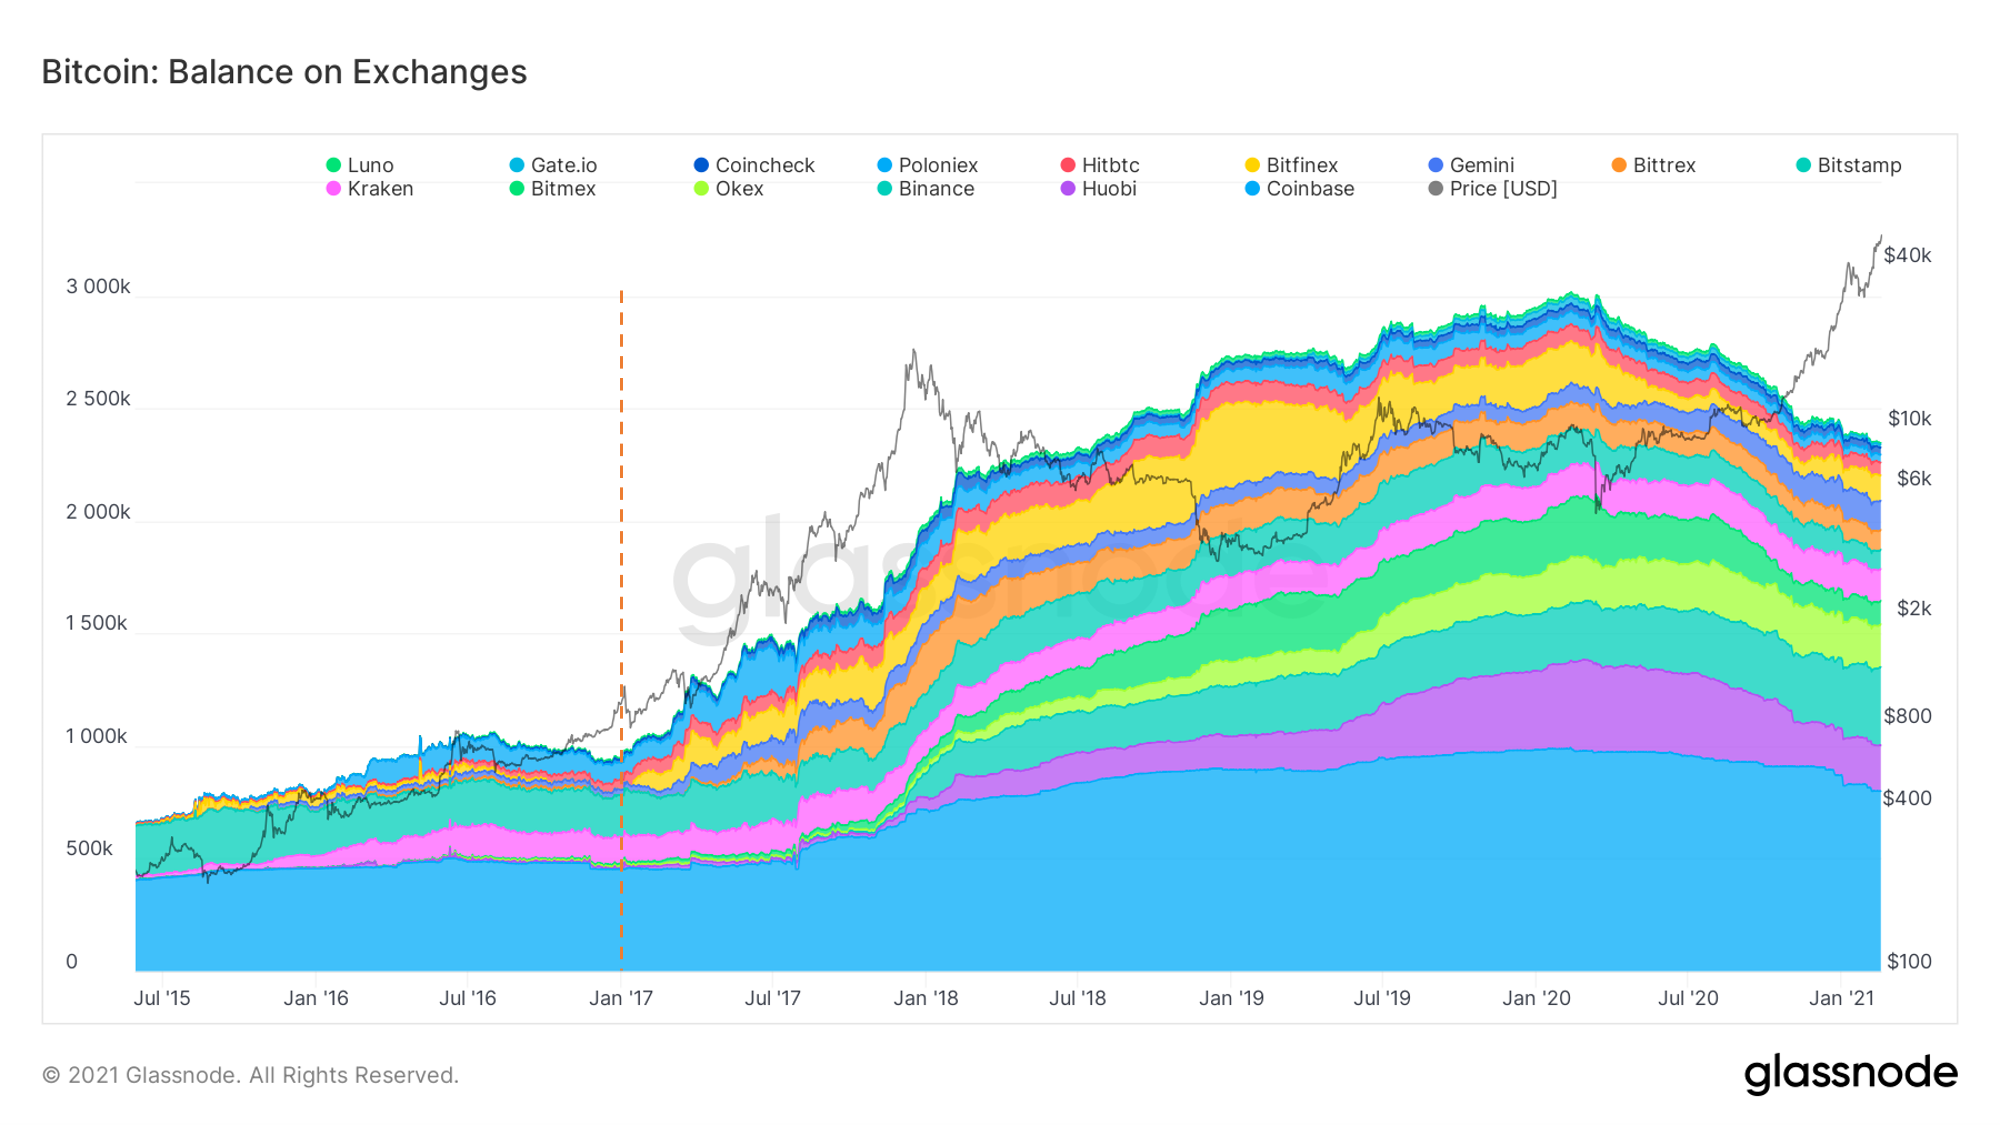
Balance on exchanges continues to decline as people take purchased Bitcoin off-exchange to HODL.

This is very bullish as it means they are not looking to sell in the near term. As long as this metric continues to decline, I find it very hard to be short term bearish.
Notice, that the first major pullback of 2017 bull run coincided with an increase of Bitcoin on exchanges. I have highlighted it with the orange dotted line on the chart. That is something to keep an eye on this time around too!
Near term Top Indicator
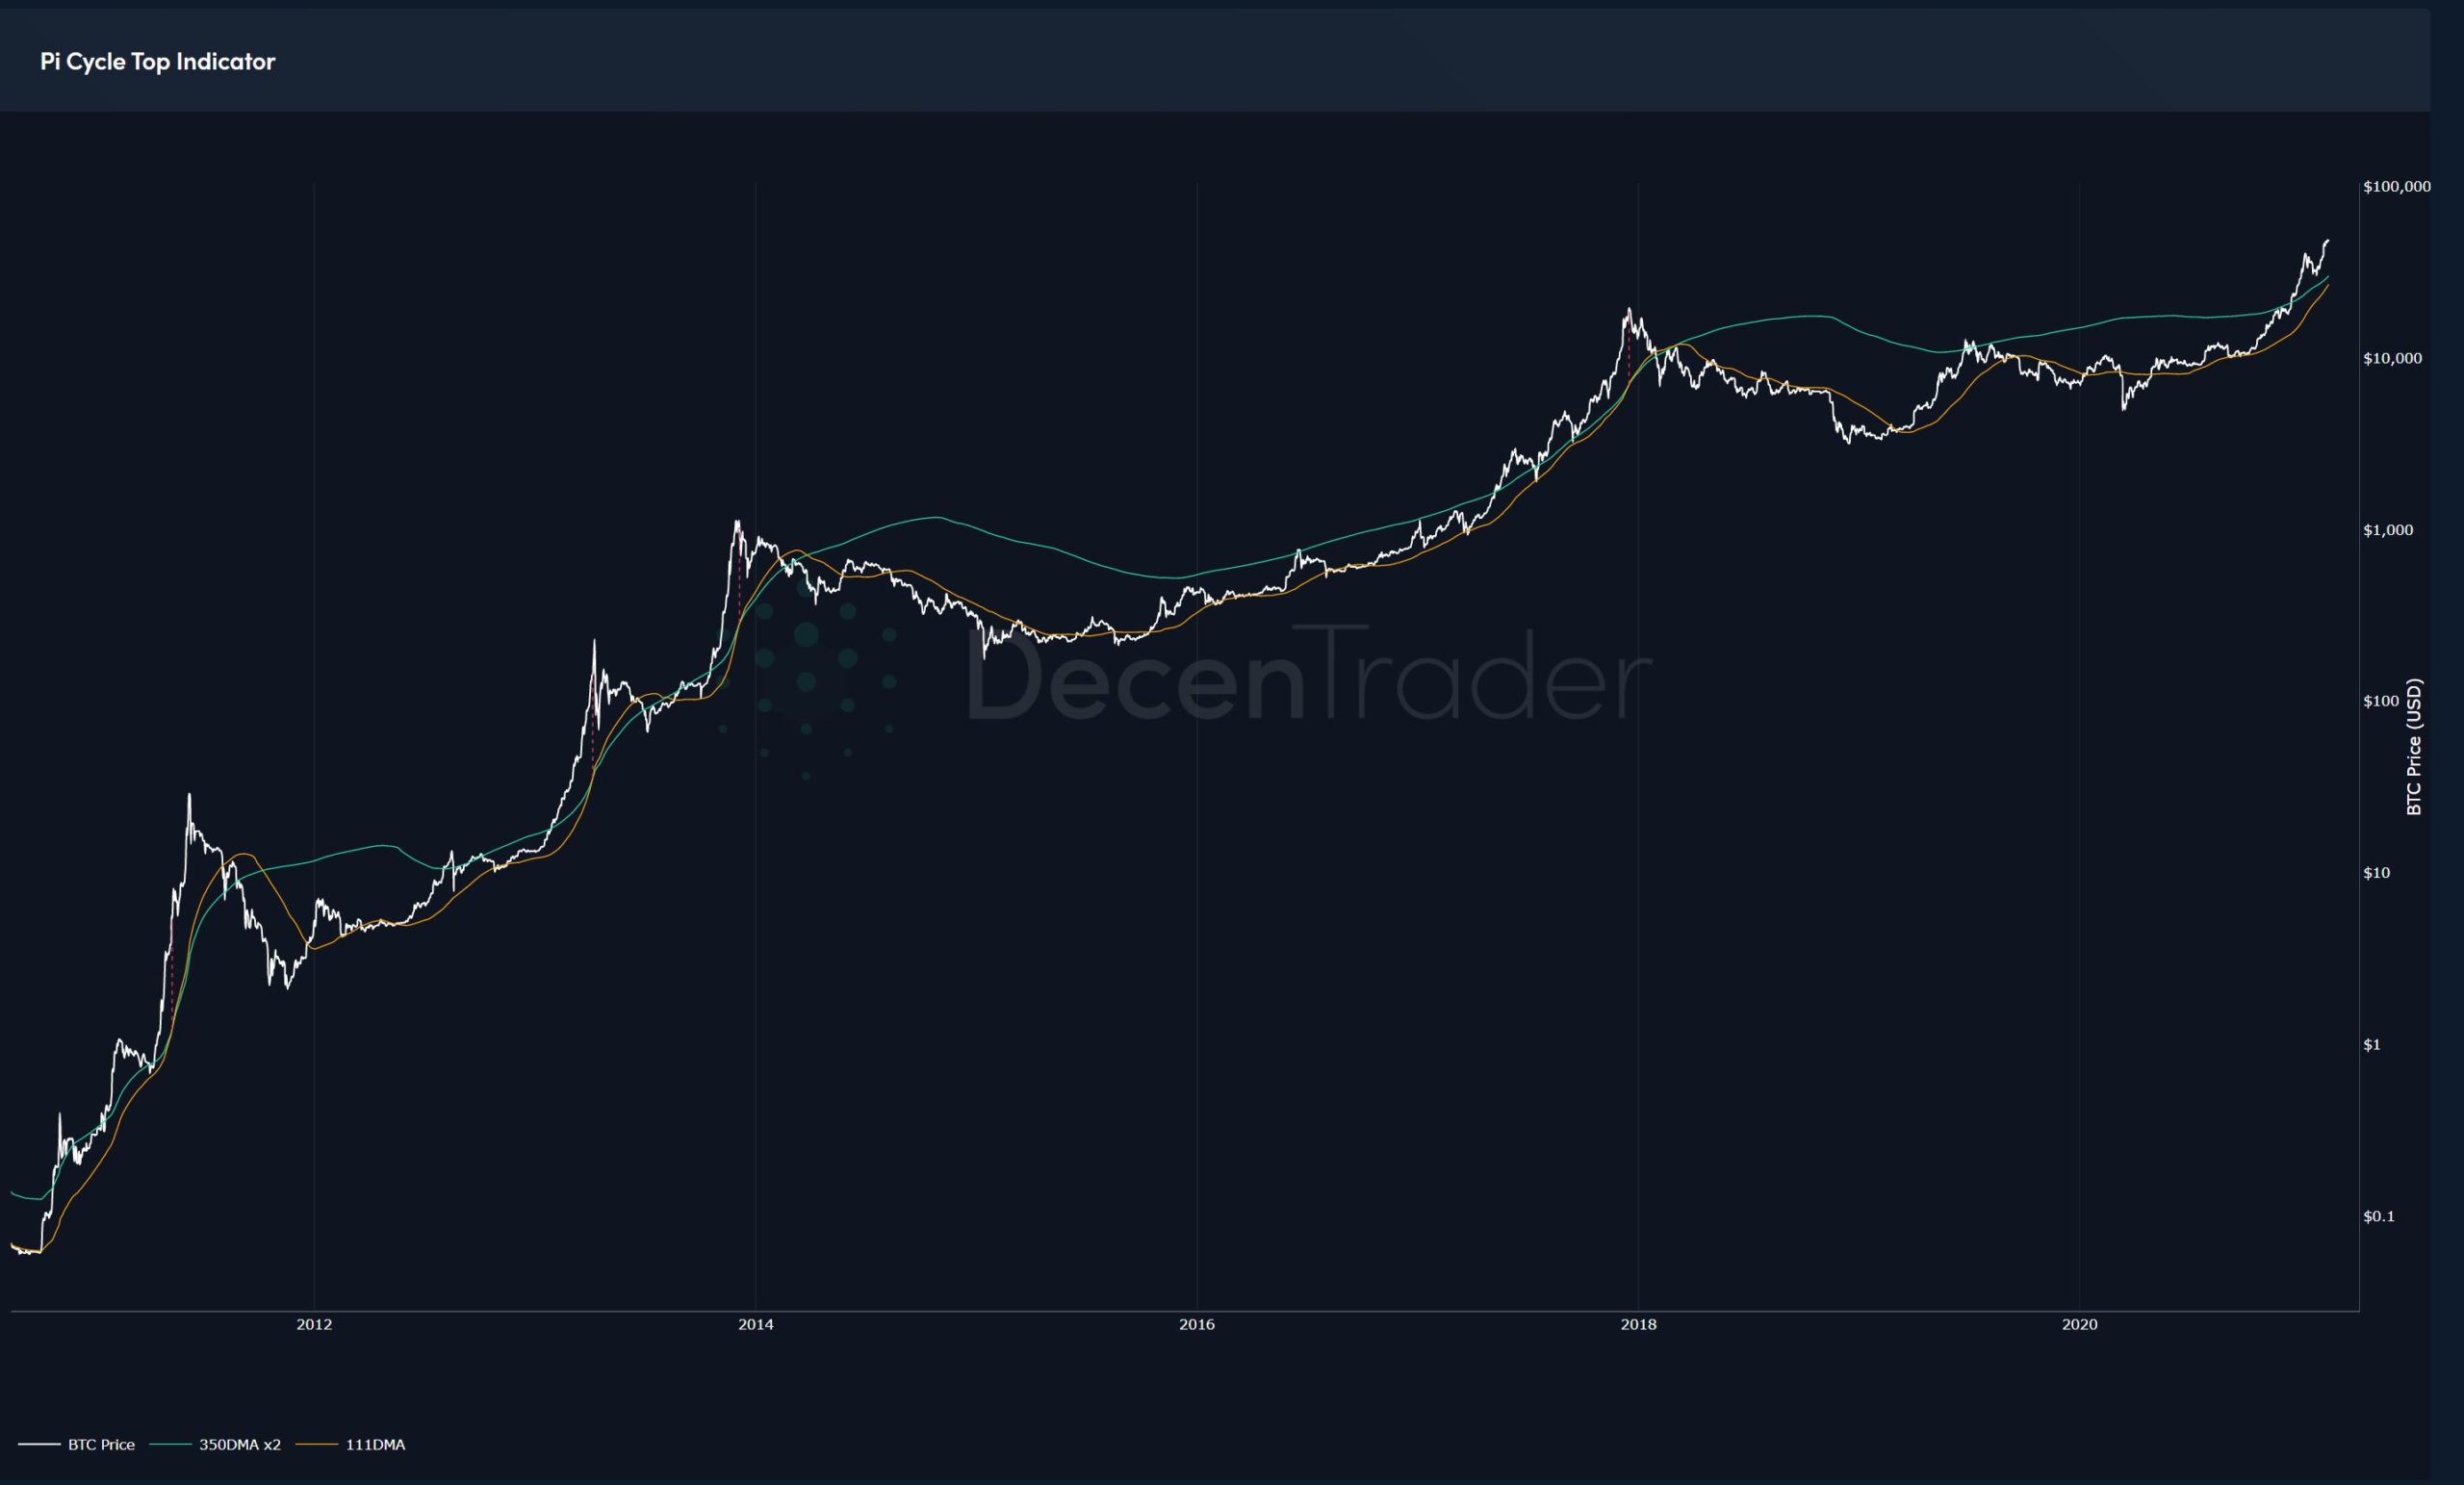
The Pi Cycle Top Indicator available on the website, has successfully picked out each of the major cycle highs since 2013 to within 3 days. This happens when the 111DMA (orange line) crosses above the 350DMA x 2 (green line).

Currently the 111DMA is fast approaching the 350DMA x 2 so this is another chart worth keeping a close eye on now. Should $BTC go parabolic over the next few weeks this indicator may provide a clue as to where Bitcoin will top out in the short term.
Bitcoin has much higher to go this cycle
Even if Bitcoin does go parabolic and tops out in the near term over the next few weeks, it will still only be an intermediate high within the larger market cycle.
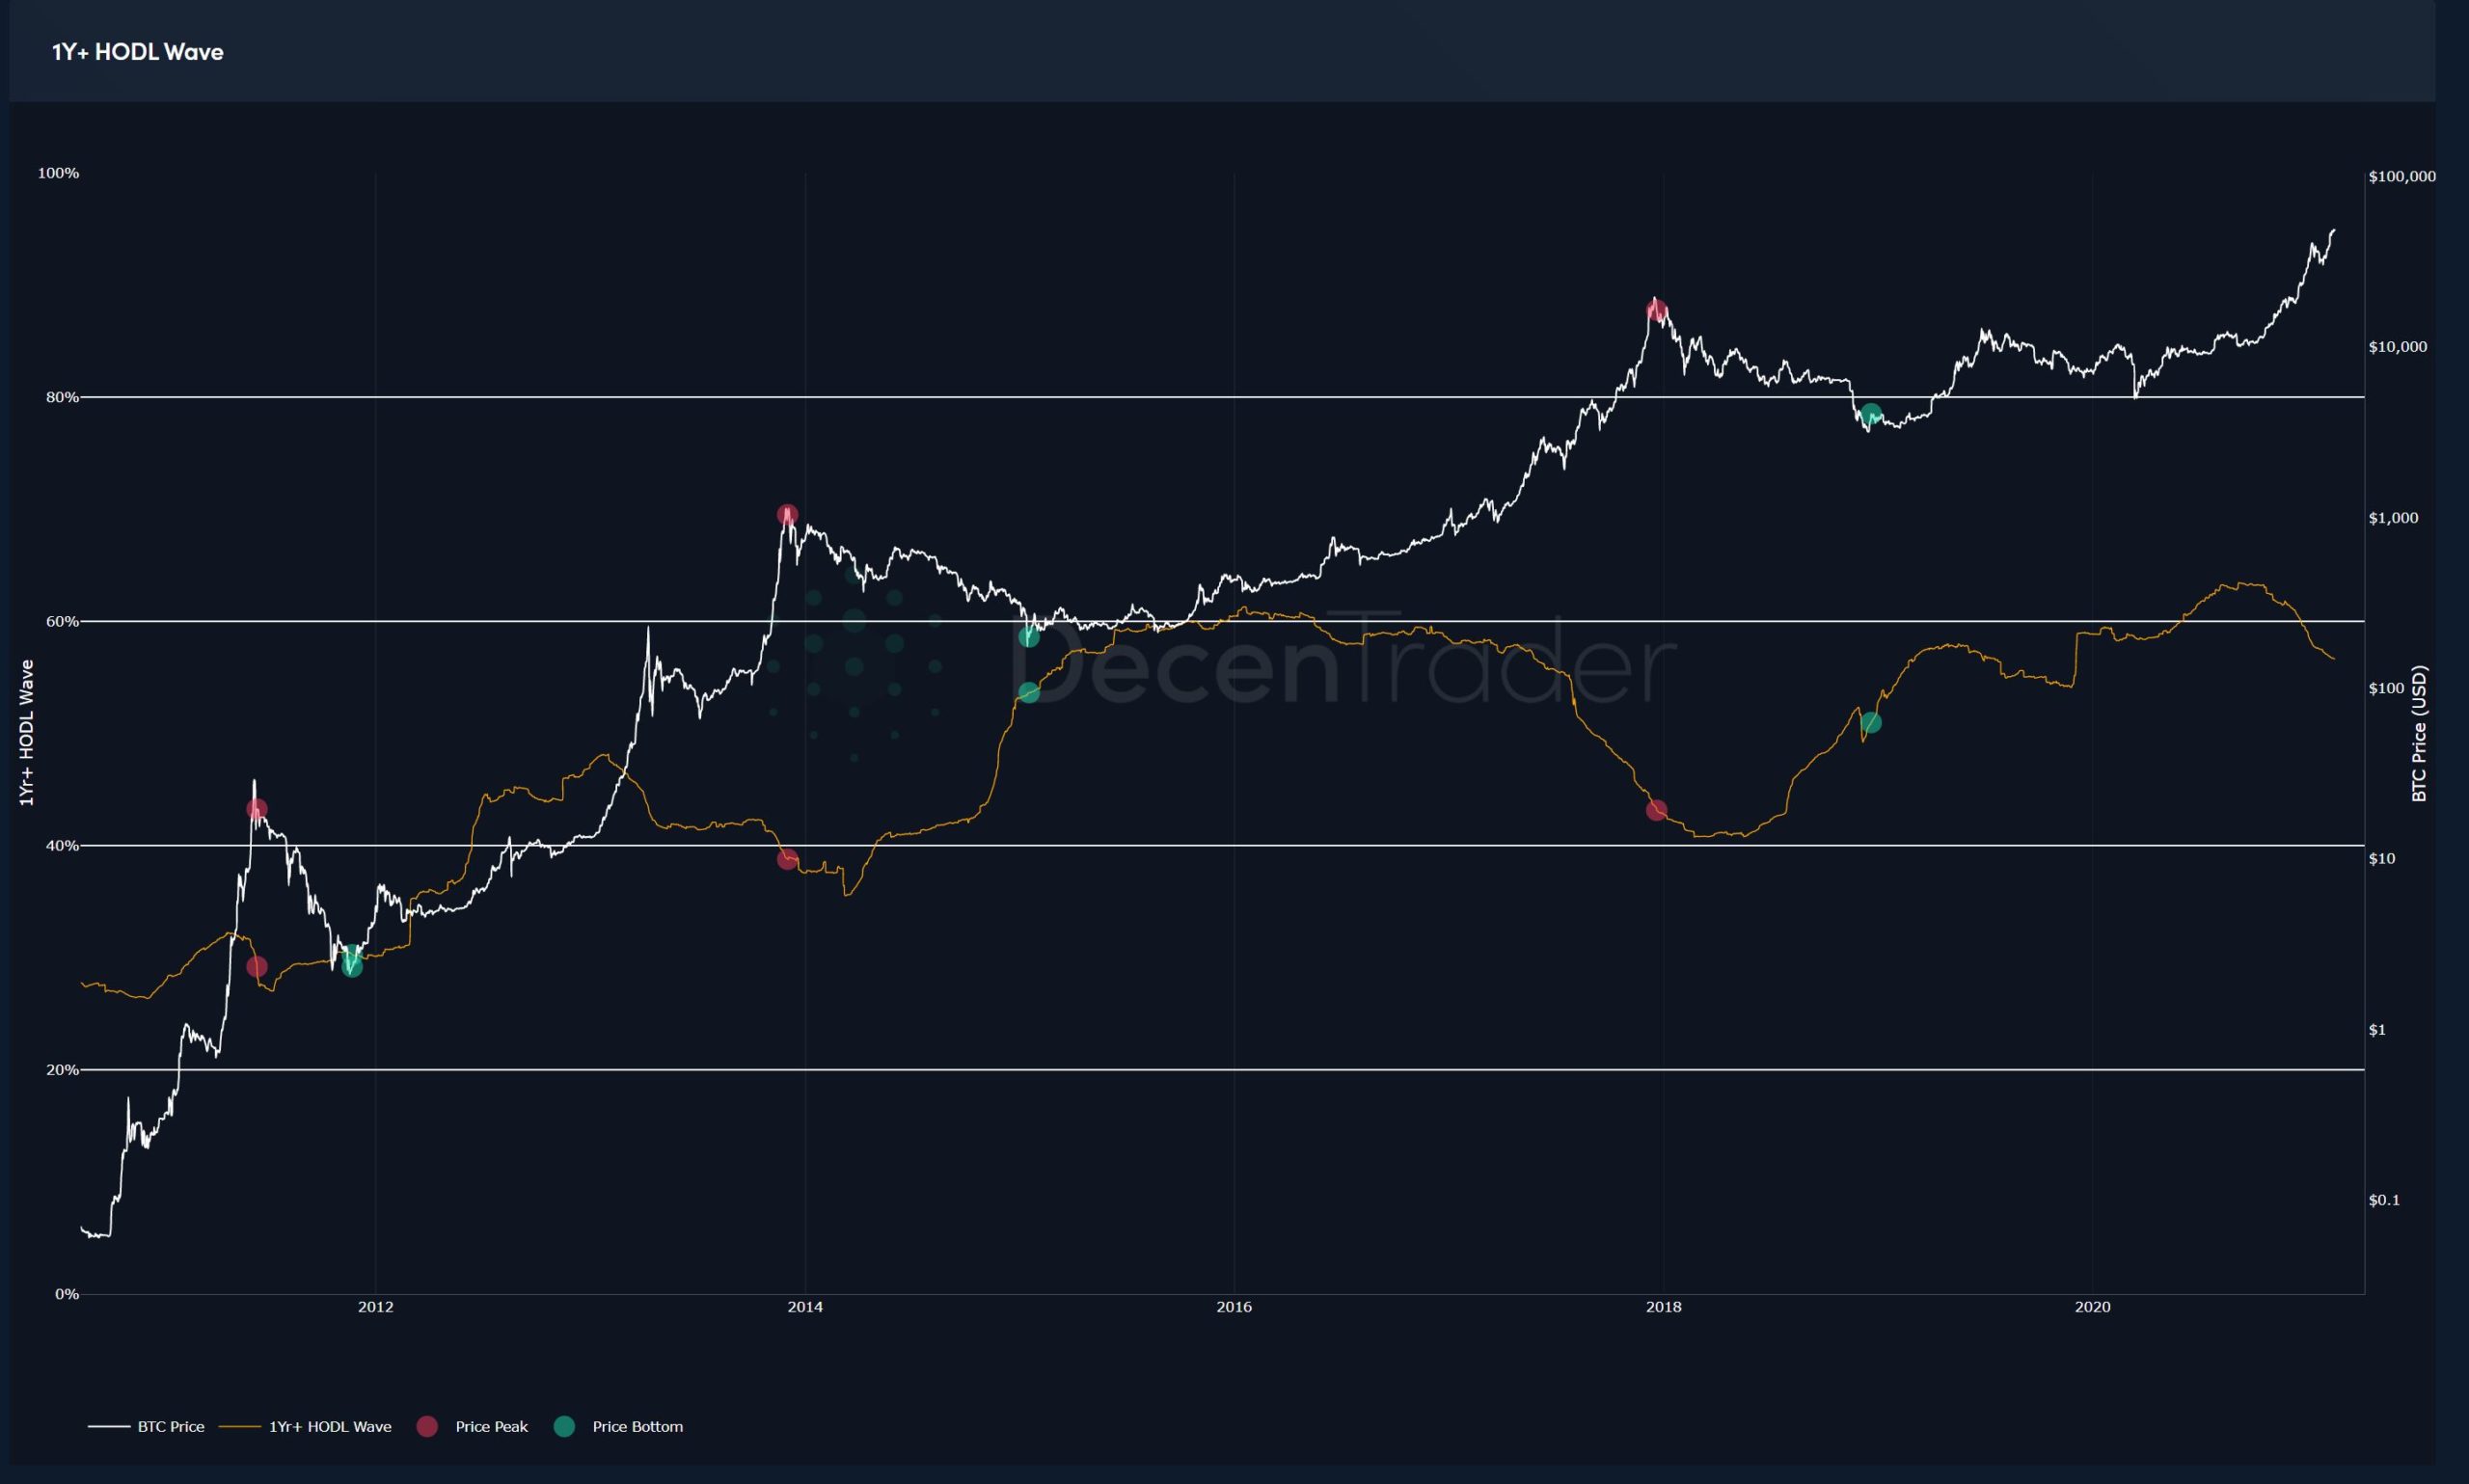
Evidence to support this can be seen on the 1yr+ HODL wave chart below. The orange line shows the number of bitcoin that has been HODL’ed (i.e. not moved on-chain to be sold) for at least a year. It is currently at 57% which is still very high. I believe this is because many long-term HODL’ers will wait until Bitcoin is above $100,000 before they start to meaningfully sell. $100k Bitcoin is now a meme.

In 2017 price finally topped out when 1yr HODL levels had dropped to 43%, shown by the red dots on the chart, as HODL’ers increasingly took advantage of the parabolic price rise. It is likely that we will see a likely situation again later this cycle around $100k.
So overall things continue to look great for Bitcoin as we now move further into the bull market.
Enjoy these times, and speak again soon.
Philip Swift
Disclaimer: Nothing within this article should be misconstrued as financial advice. The financial techniques described herein are for educational purposes only. Any financial positions you take on the market are at your own risk and own reward. If you need financial advice or further advice in general, it is recommended that you identify a relevantly qualified individual in your Jurisdiction who can advise you accordingly.


