Market Update – Retrace before run up?
Bitcoin price action has stalled in recent days as price failed to reach $50,000 following a strong rally in recent weeks from the lows of $29,000.
At the time of writing, there are concerns that the Federal Reserve may look to reduce their bond-buying which has spooked traditional markets. This concern appears to be spilling over into crypto also, halting Bitcoin’s ascent in the near term.
Price has dropped back below the 200DMA over the past 48 hours, and we can also see using the Moonraker indicator that price is now below the mean reversion line…which is short-term bearish. Bulls need to see a reversal and a reclaim of both the 200DMA and Moonraker mean reversion levels which are currently sitting at $45,600.
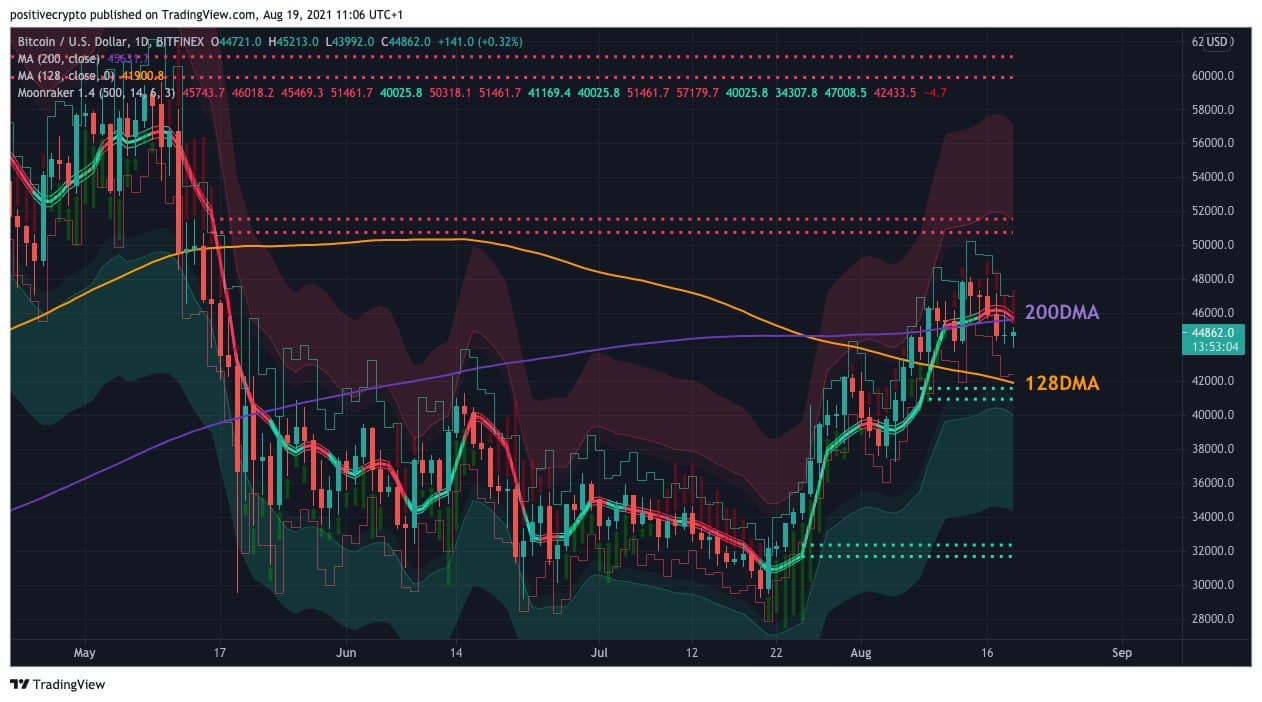
Fig 1: Price dropping below the 200DMA and Moonraker mean reversion levels.
Should the price continue to drop, the next major support lies just below $42,000 where there is the 128DMA and also Moonraker Support highlighted by the green dotted lines on the chart above. We would expect to see buyers step in around those levels if the price were to drop that far down.
Active Address Sentiment Indicator
Another indication that price may need to pause its ascent in the near term is the Active Address Sentiment Indicator. This looks at the monthly rolling change in price relative to the monthly rolling change in active addresses. This gives us a very clear sense as to whether the price is over-extended in the near term (1-3 weeks).
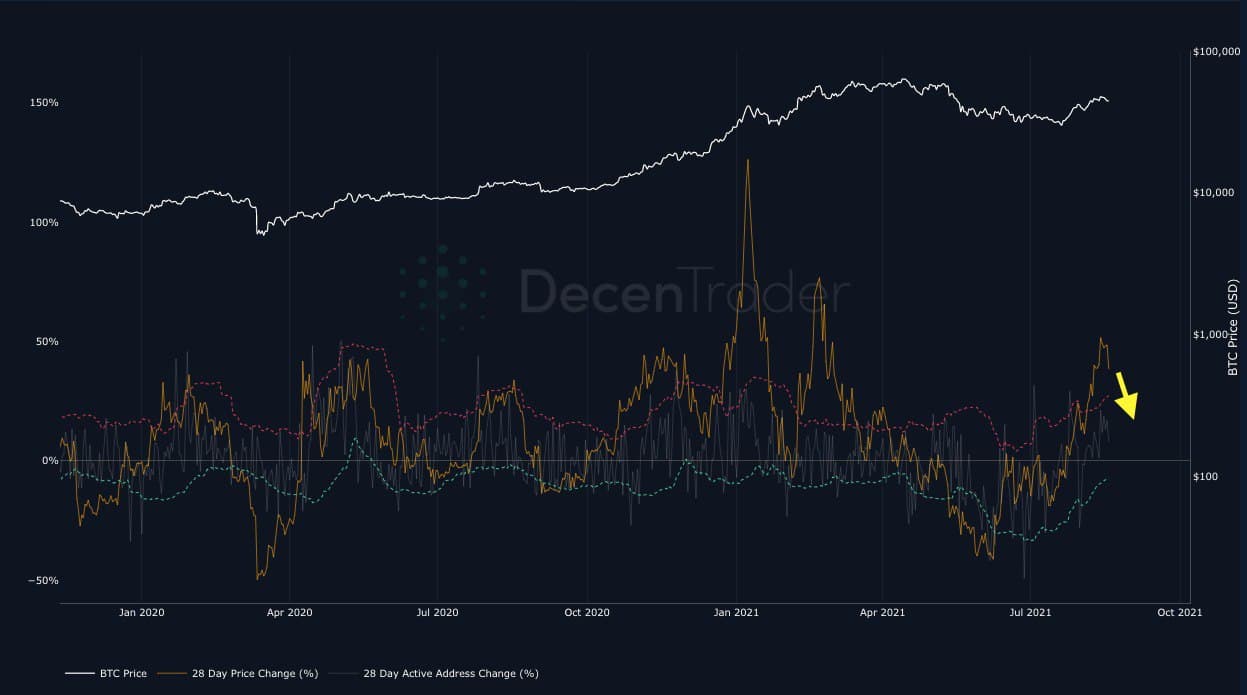
Fig 2: Active Address Sentiment Indicator suggests price may need to pause before rallying higher.
The indicator has now breached the upper red boundary. When this happens it indicates short-term price action has rallied too far ahead of active address growth. Historically, we have seen price growth slow when this occurs, until active address growth catches up. So we may need to wait until this indicator drops back below the red boundary before the price continues higher.
Funding remains low
What is encouraging for the bulls is the current low funding rates. They are shown by the bars on the bottom section of the chart below. These low funding rates show that traders are not overleveraging with long positions. Suggesting that across the coming week’s price can continue higher as there is not too much long leverage in the system.
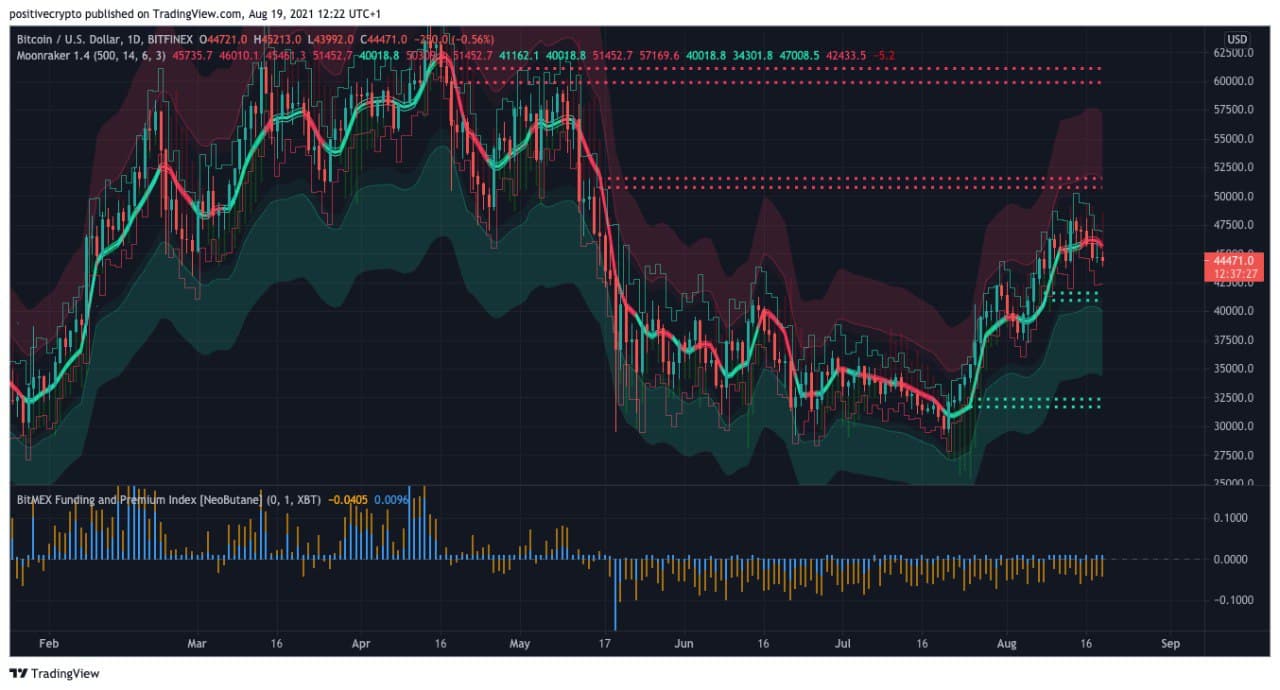
Fig 3: Funding rates are significantly lower than they were in the February run-up.
Despite the recent run-up, bullish confidence among traders continues to remain low after the major crash in May and the subsequent sideways price action. Such disbelief in a bull market has typically resulted in price appreciation for Bitcoin over medium to long-term time horizons.
Miners comfortable
This is particularly the case when miners are not looking to sell bitcoin en-masse. Typically this happens either during times of distress (forced selling) or when the market is euphoric and miners look to realize profits.
The Puell Multiple is a useful tool to highlight such periods. However, currently the indicator (blue line) is sitting comfortably right in the middle of the range as we continue to see miners coming back online successfully after relocating from China. This is definitely a chart worth paying attention to when the market is at the extremes, but for now, like funding rates, it is another bullish signal suggesting that there are few barriers holding back potential price appreciation in the coming weeks and months.
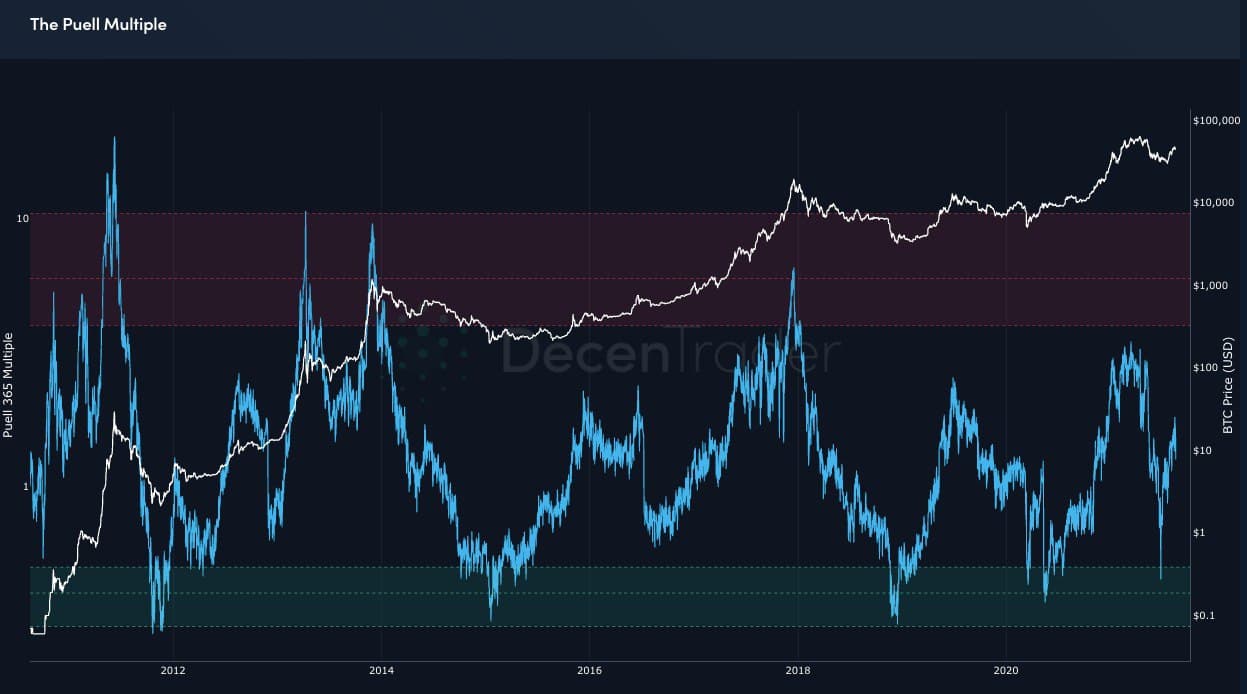
Fig 4: Puell Multiple (blue line) sitting in the middle of the range following the recent spike into the green zone as miners fled China.
4hr timeframe going into the weekend
At the time of writing, $BTC is currently forming a range between $44,000 and $48,000. The volume point of control is noticeably forming a mid-point for that range at $46,100. This level also aligns with 4hr Moonraker mean reversion line, so we anticipate at least a retest of that level.
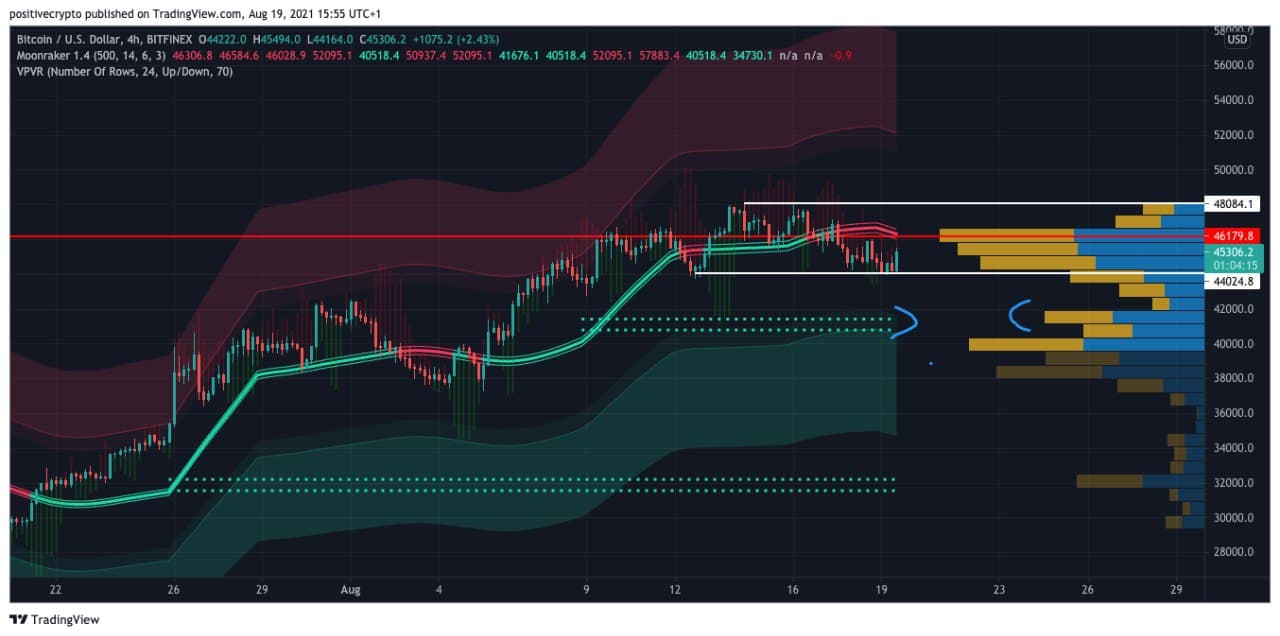
Fig 5: Bitcoin ranging on the 4hr chart with volume node support at $42,000.
Should price be able to reclaim that level then the next target will be the top of the range at $48,000. Should it fail then once again we see Moonraker support down at $41,000-$42,000 which aligns with the next significant volume node.
So while Bitcoin looks very strong on high time frames, there may be some near-term downside as the price cools off from the big run up of recent weeks, and as we head into the weekend. Any risk should therefore be managed appropriately over the coming days. If you want to have a more in-depth view of PA join our community HERE.
Speak soon,
Decentrader Team.
Relevant links: Moonaker indicator
Disclaimer: Nothing within this article should be misconstrued as financial advice. The financial techniques described herein are for educational purposes only. Any financial positions you take on the market are at your own risk and own reward. If you need financial advice or further advice in general, it is recommended that you identify a relevantly qualified individual in your Jurisdiction who can advise you accordingly.


