Market Update: The Return of The Bull
In my previous market update, I mentioned that one of the major things we were looking for, for Bitcoin to resume the bullish trend, was a reclaim of the 50 DMA and a 3 day Green predator flip, which is the strongest bullish signal for us at Decentrader.
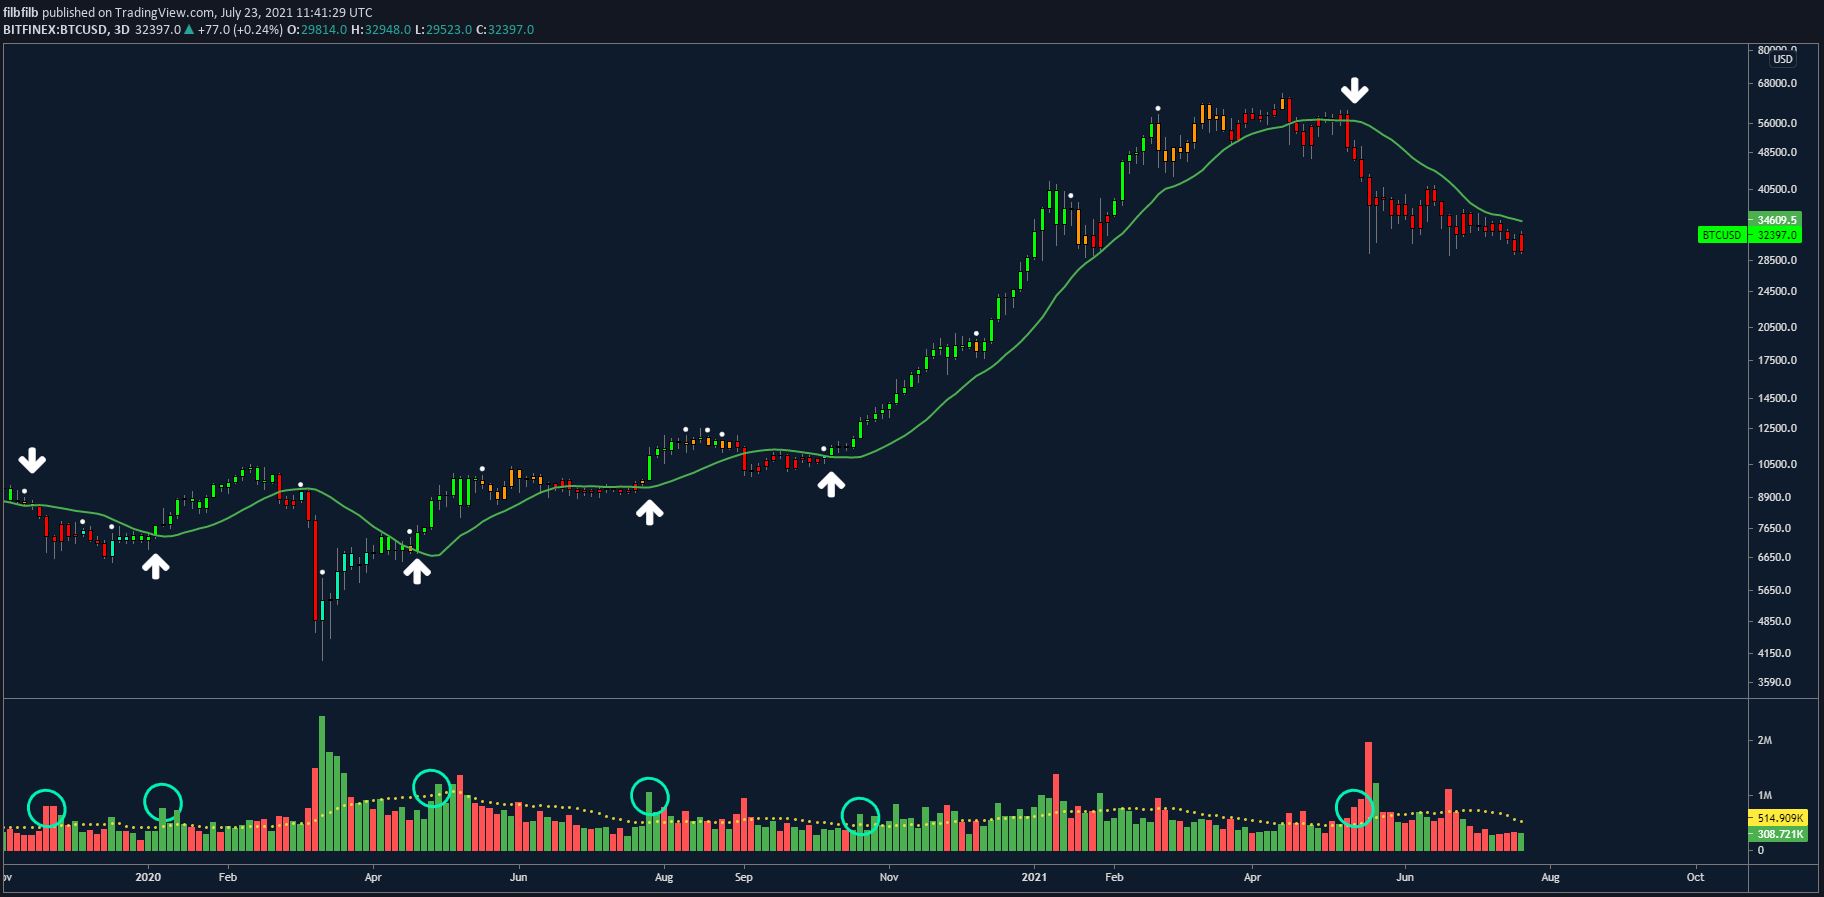
Fig. 1 3 Day Predator Indicator & Volume – https://www.tradingview.com/x/fzvTvrIm/
Correction Into Golden Cross
As can we see in the below chart, this condition was met at $34k, after which the bulls took control and have now retested the $52k level. This was significant as, along the way, both the 20 WMA (Yellow line) and the 200 DMA (red line) were also both reclaimed which are usually considered essential in establishing a significant shift in trend.
Tuesday 7th September saw a sharp selloff back towards the 50 DMA and the 20 WMA; almost a 20% pullback, before a sharp bounce back above the 200 DMA. The selloff came amidst a pending ‘Golden Cross’ where the 50 DMA crosses above the 200 DMA. This is often seen as being a very bullish sign for the market and typically for Bitcoin, we see dumps into ‘Golden Crosses’ and pumps into ‘Death Crosses’, So on this basis alone, the pullback wasn’t too much of a surprise.
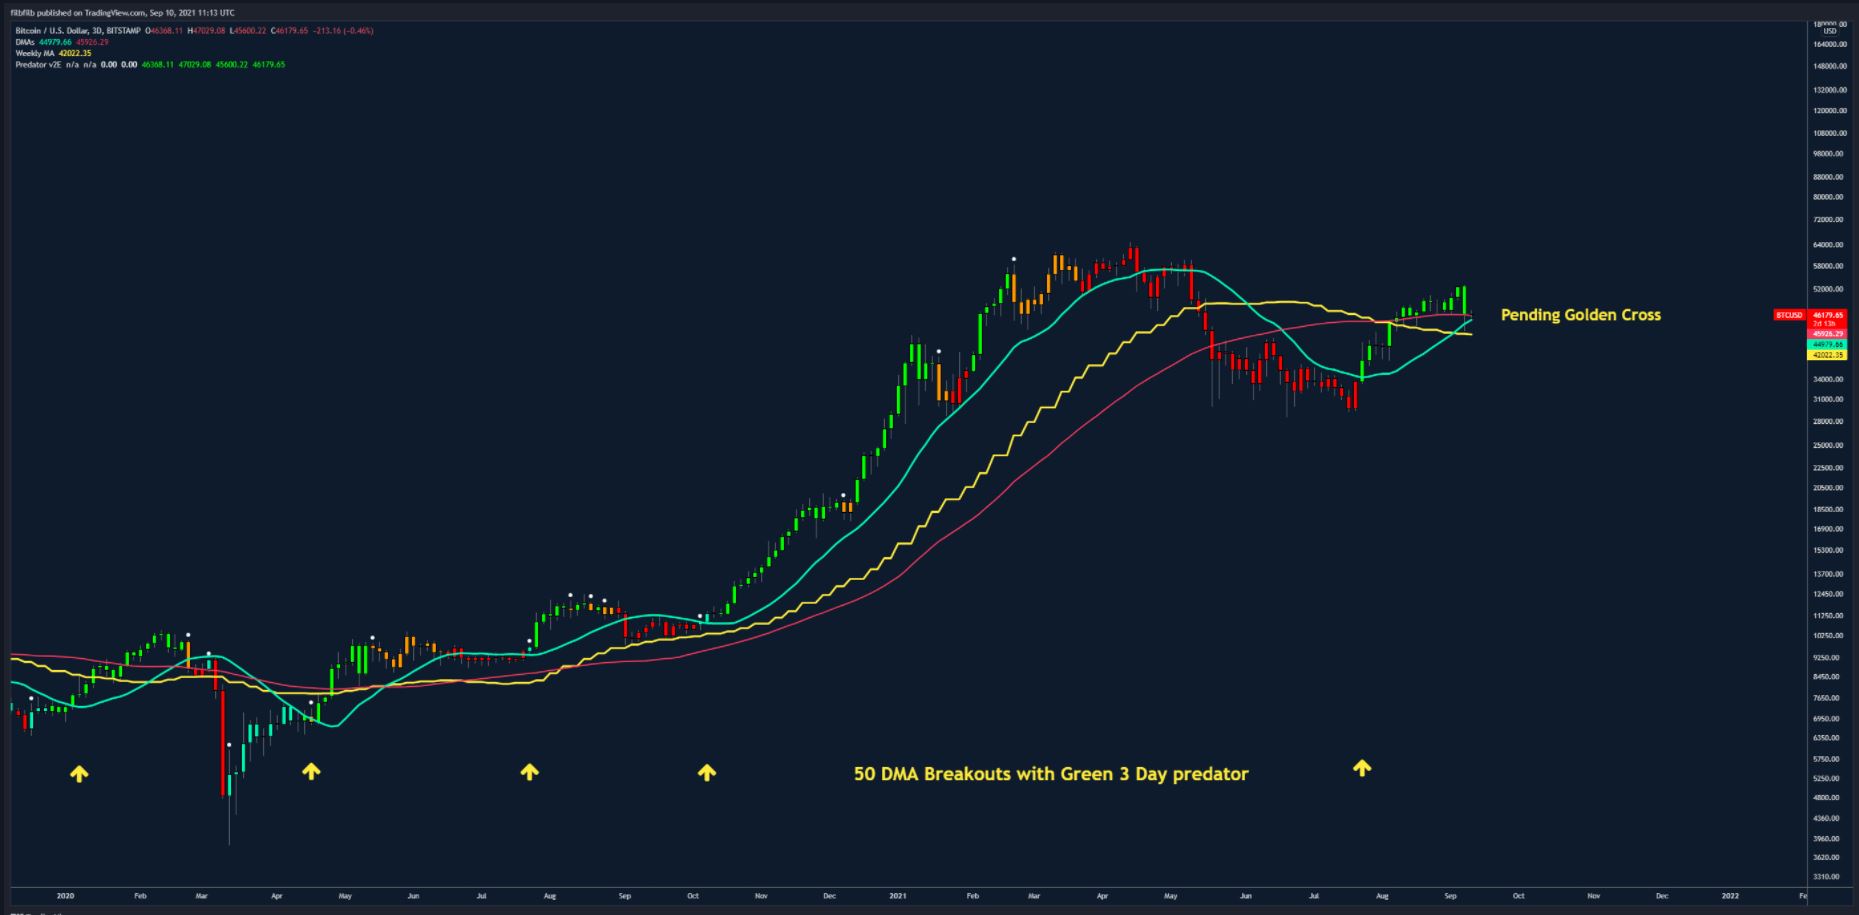
Fig. 2 – 3 Day Predator Indicator – https://www.tradingview.com/x/X1u8kyfY/
Get Predator Indicator HERE.
1 Day Chart
The one Day chart shows quite clearly that the 200 DMA (red line) is holding the price at the moment, around the 38.2% Fibonacci retracement from the $52k high, at $46k, with the 50 DMA closely pulling up from below at $45k.
For Bitcoin to remain bullish, these two moving averages will need to be maintained, with any price action lower being intraweek – a weekly close below the 50 DMA would not be attractive, particularly if the 20 Week moving average is also lost (yellow line currently around $42k)
The 20 WMA currently represents the top of the previous range which we are assuming to have been reaccumulation. For this theory to hold, we should expect the previous range to act as support. Any time spent below would need to see a strong rejection off the 1 Day support & 61.8% retracement level around $38k and a bounce relatively quickly back above the key moving averages.
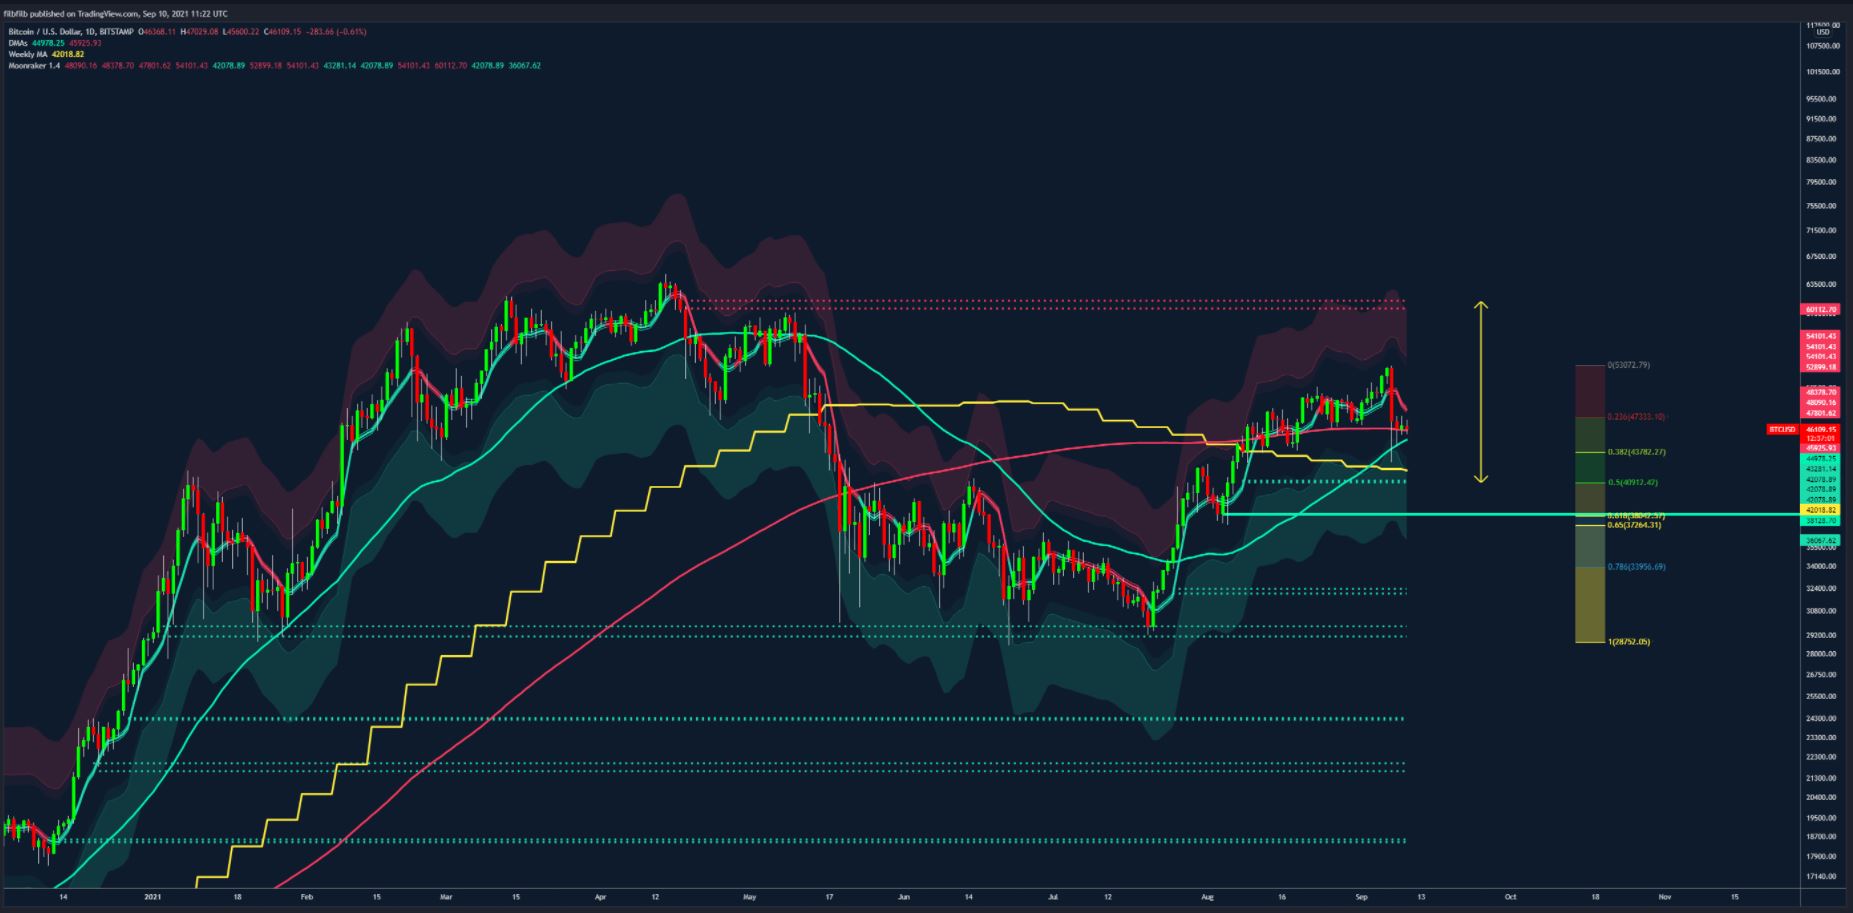
Fig. 3 – 1 day Chart with Moonraker Indicator
Get The Moonraker HERE.
Looking at the order book, it is evident that there is Ask Dominance within the 1-3% price range, which hints at further supply to work through, with the bears providing supply pressure on top of the 200 DMA. However, within the 10-25% range, we can see that there are more buyers than sellers, which is in confluence with the idea that a 10% drive lower towards the 61.8% retracement at around $38k, would see the bulls step in, which as mentioned above, would be the level that a sharp bounce would be needed.
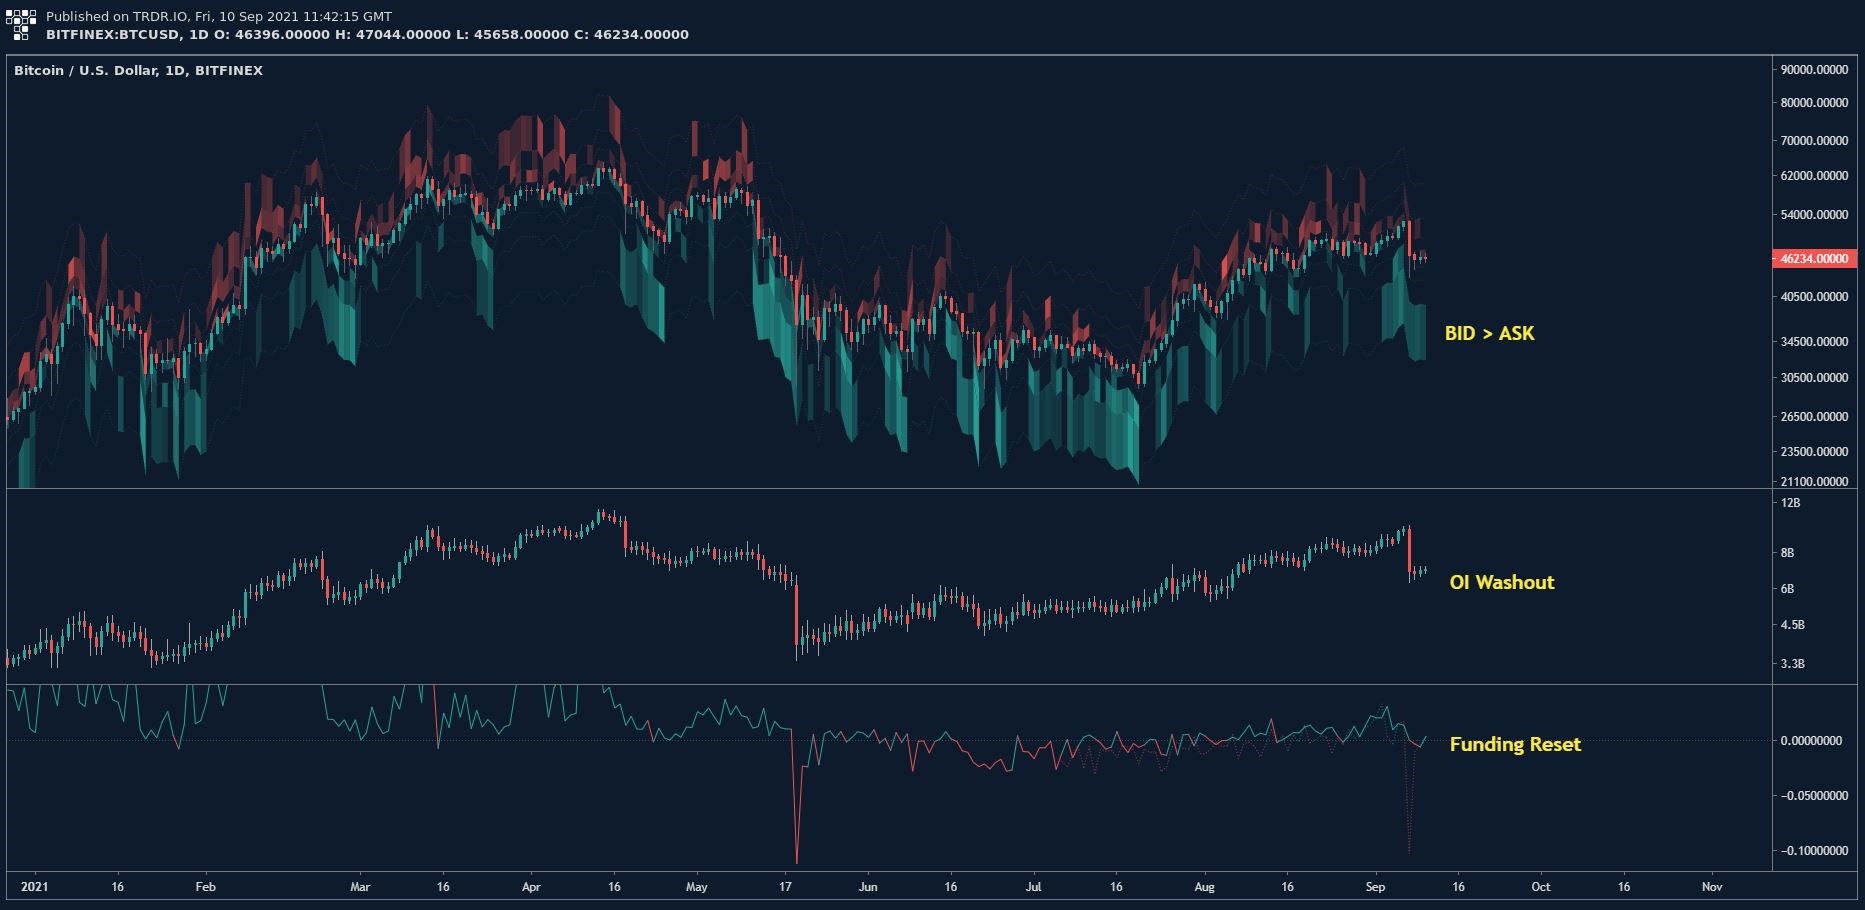
Fig. 4 – 1 day Chart with OI, Bid/Ask Depth and Funding rates https://trdr.io/snapshot/5AF4C31AE5D66E9D.png
The above chart also shows, that Open Interest has been reset, but remains high, at around the same level that saw a further push lower from these prices back in May, however this time, funding is decisively lower showing that the market is in more of an equilibrium, but does mean that there is enough leverage in the system to entertain sharp moves in price action.
Bitcoins held in reserve by Exchanges is showing that since the sell-off on the 7th, the Bitcoins being held has been reduced quite sharply which may indicate accumulation taking place, but more importantly, there has not been an increase in deposits, similar to that witnessed after the sharp selloff from $60k.
This will be one chart we are keeping a close eye on over the coming week in case there is a large increase in supply, which may be indicative of a forthcoming deeper correction.
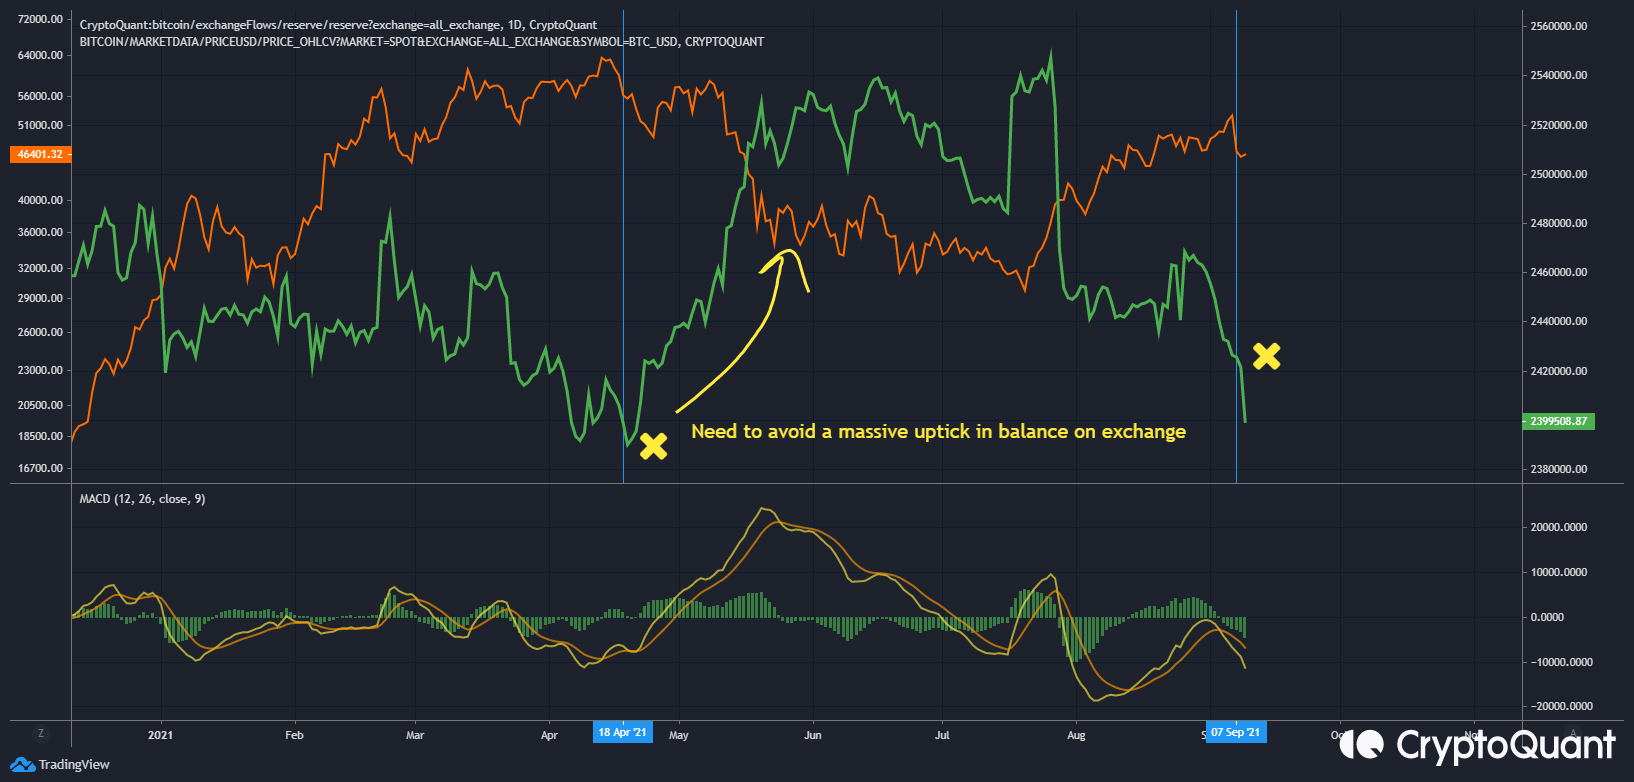
Fig. 5 Bitcoin Reserves held on exchange – Source – CryptoQuant
Spent output profit ratio (SOPR)
The SOPR chart demonstrates the extent to which market participants are selling above (red) or below acquisition price (green). In a bull market, where we see a green print or selling below cost, this is often a reasonable buy the dip signal. At present we are currently seeing this condition being met, which although does not mean price cannot go lower, does indicate that current price action may be a buying opportunity.
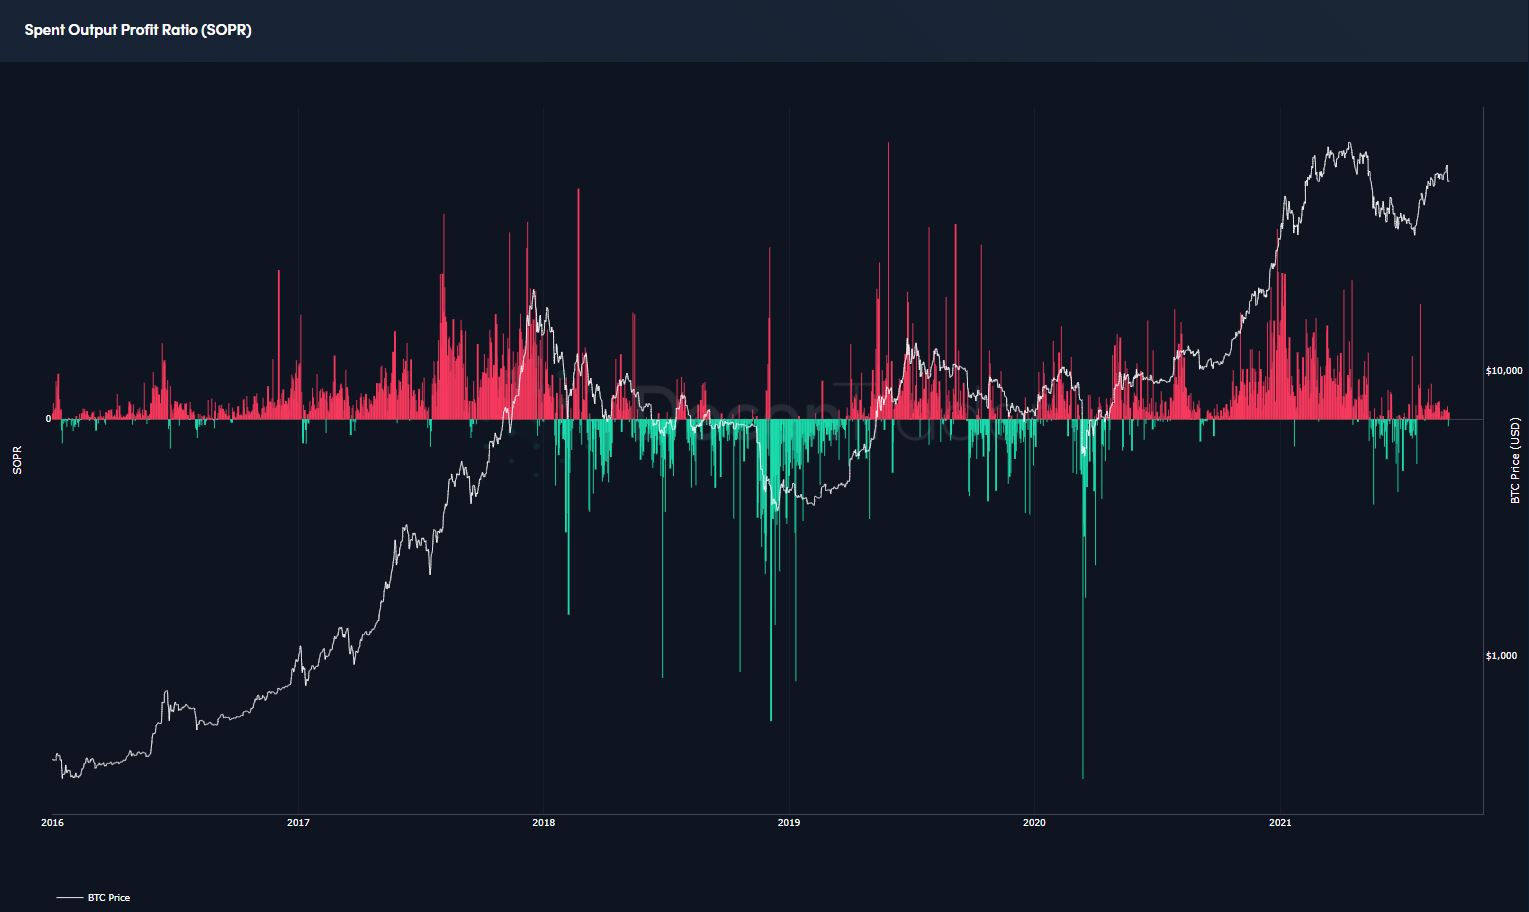
Fig. 6 – Decentrader SOPR chart – Read More Here
4 Hour chart
The 4-hour chart further highlights price action around the 200 DMA; currently supporting price. The point of control of the price range is yet to be reclaimed. Should this occur over the weekend on lower timeframes, price is likely to drift to the VAH of the range and the 61.8% retracement level of the sell-off; around $49k and would potentially provide a reasonable short term trade to the upside.
The VAH level is likely to be very important – reclaiming 49k and flipping into support is what we are looking for in terms of bullish continuation, which would likely open the door to $58k. We are anticipating that this may be difficult to achieve on the first attempt and as such are expecting this to act as an area of supply.
Get Access TRDR Here: https://trdr.io/a/decentrader
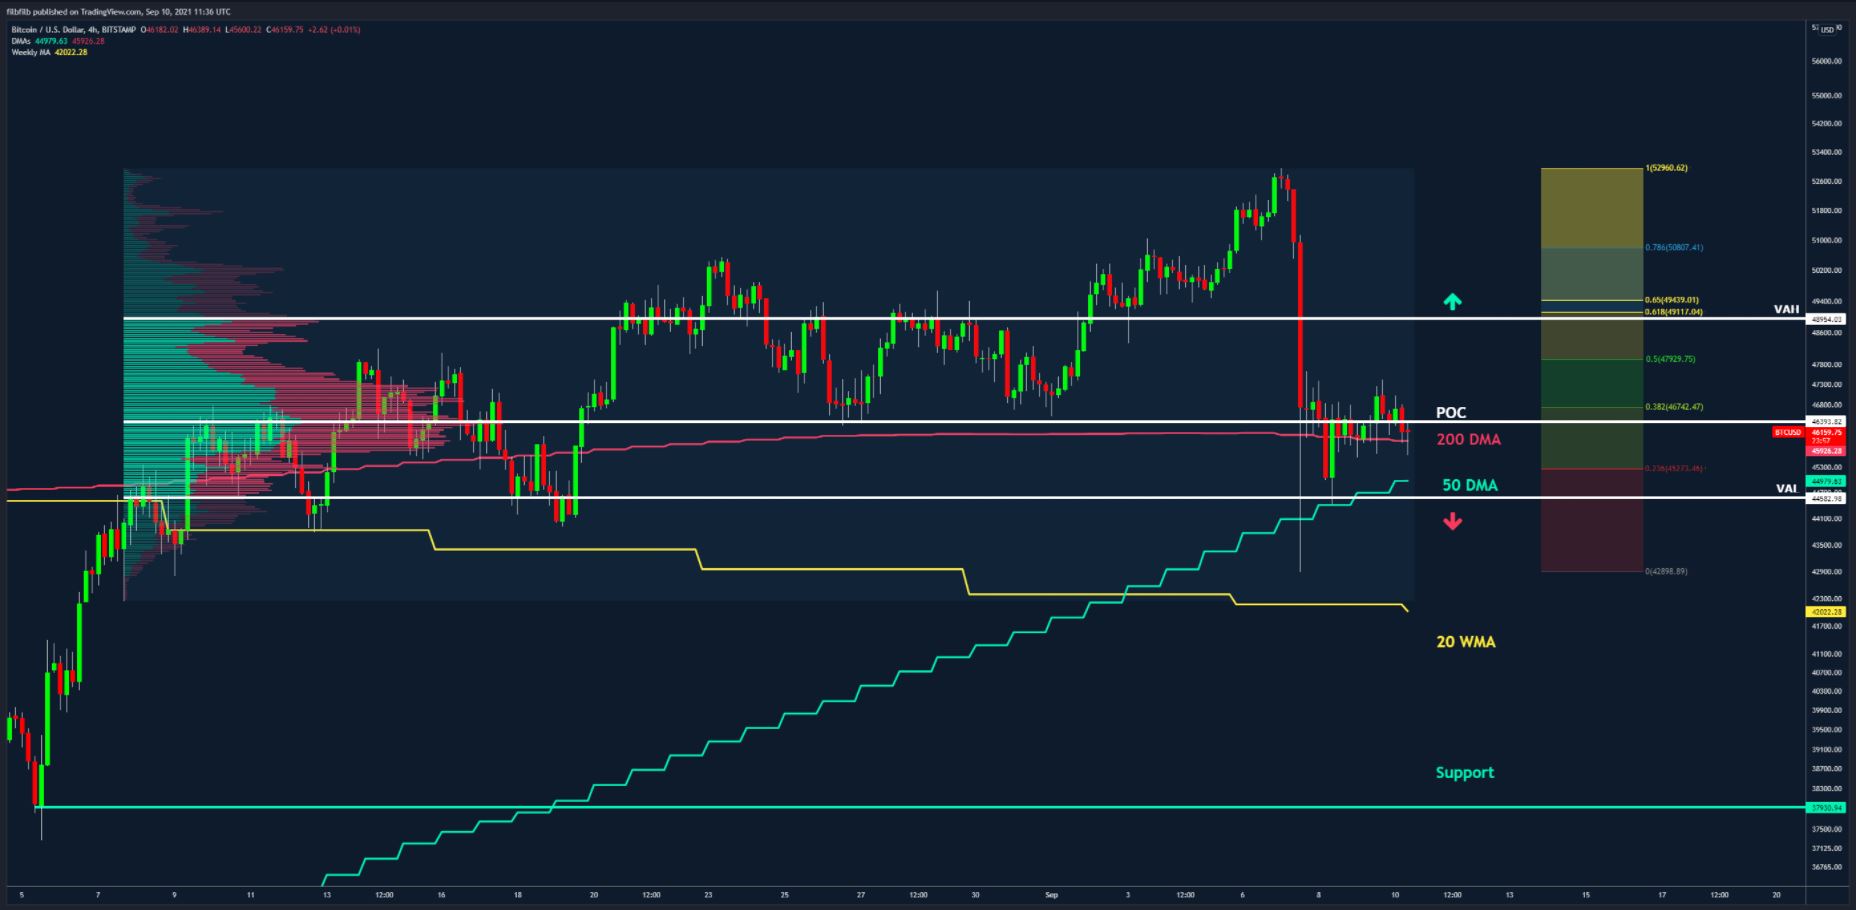
Fig. 7 4 Hour Bitcoin chart https://www.tradingview.com/x/paP2ZZaz/
Price action below the 50 DMA and in particular, price-finding resistance at the VAL of $44.5k, would likely see the 20 WMA and potentially the support at 39k tested, along with the Bid support aforementioned.
As such, our trading plan was to fill spot bids at $44.5k, which was executed, and are waiting on lower prices at the 20 WMA and the $38k levels to add to a longer-term swing trade into our forecasted trade idea for the final quarter of 2021. If the lower objectives are met, as mentioned, prices supported above 49k will be of interest. Sustained price action below these prices would indicate Bearish price action for the remainder of 2021.
Forecast & Onchain analysis
With prices above key moving averages and the general global Macro environment favoring Bitcoin, alongside continued infrastructure and onramps being refined, we remain bullish on the cryptocurrency market heading towards the final quarter of 2021. Stablecoins have seen a 77% increase towards a Market Cap of $33.7bn since the move from $30 to $60k earlier in the year, with a 14% increase since Bitcoin broke out of the $42k range. This shows quite clearly that there is continued demand for cryptocurrency and is a metric that we interpret as being bullish for the market overall.
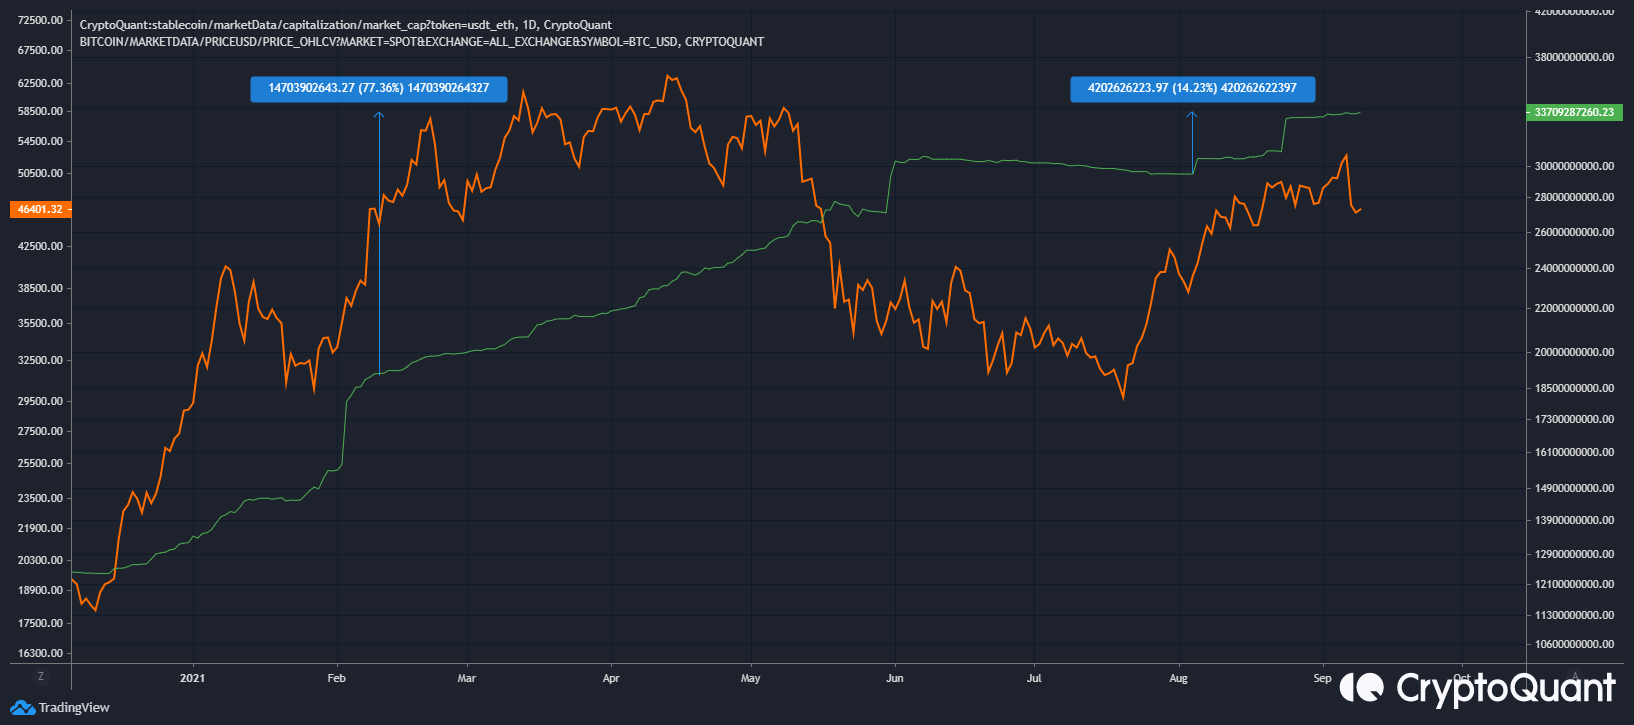
Fig. 8 Bitcoin Reserves held on exchange – Source – Crypto Quant
Total Market Cap shows that the overall market is facing resistance at an incredible $2tn. The Total Market Cap, chart illustrates that the total market is actually more bullish than Bitcoin on its own – with the difference being made up by the Altcoins which have been particularly strong.
Total Cap and Alts
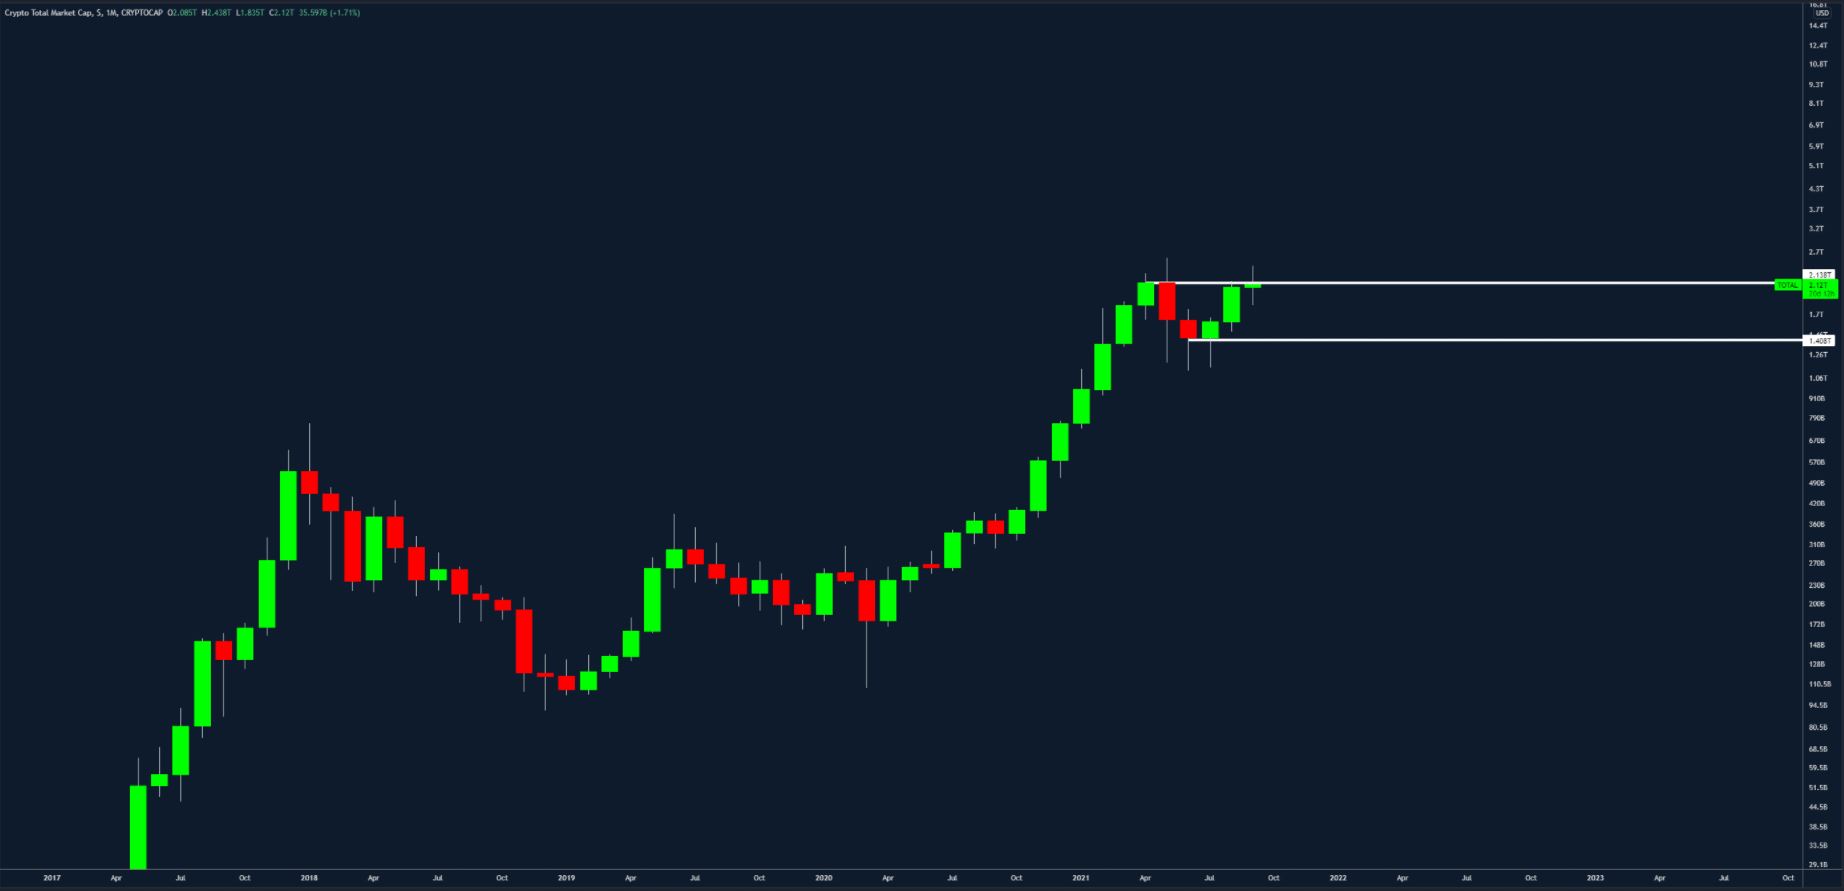
Fig. 9 – Total Market Cap https://www.tradingview.com/x/FmSc4xF7/
The below chart shows the Altcoin market cap, which is pressing towards new highs, with a new ATH close for the month of August. This is in stark contrast to the 2017 top scenario, where we saw the market struggle to retest the monthly highs, with this time, the Altcoins pressing higher and decisively more bullish than Bitcoin.
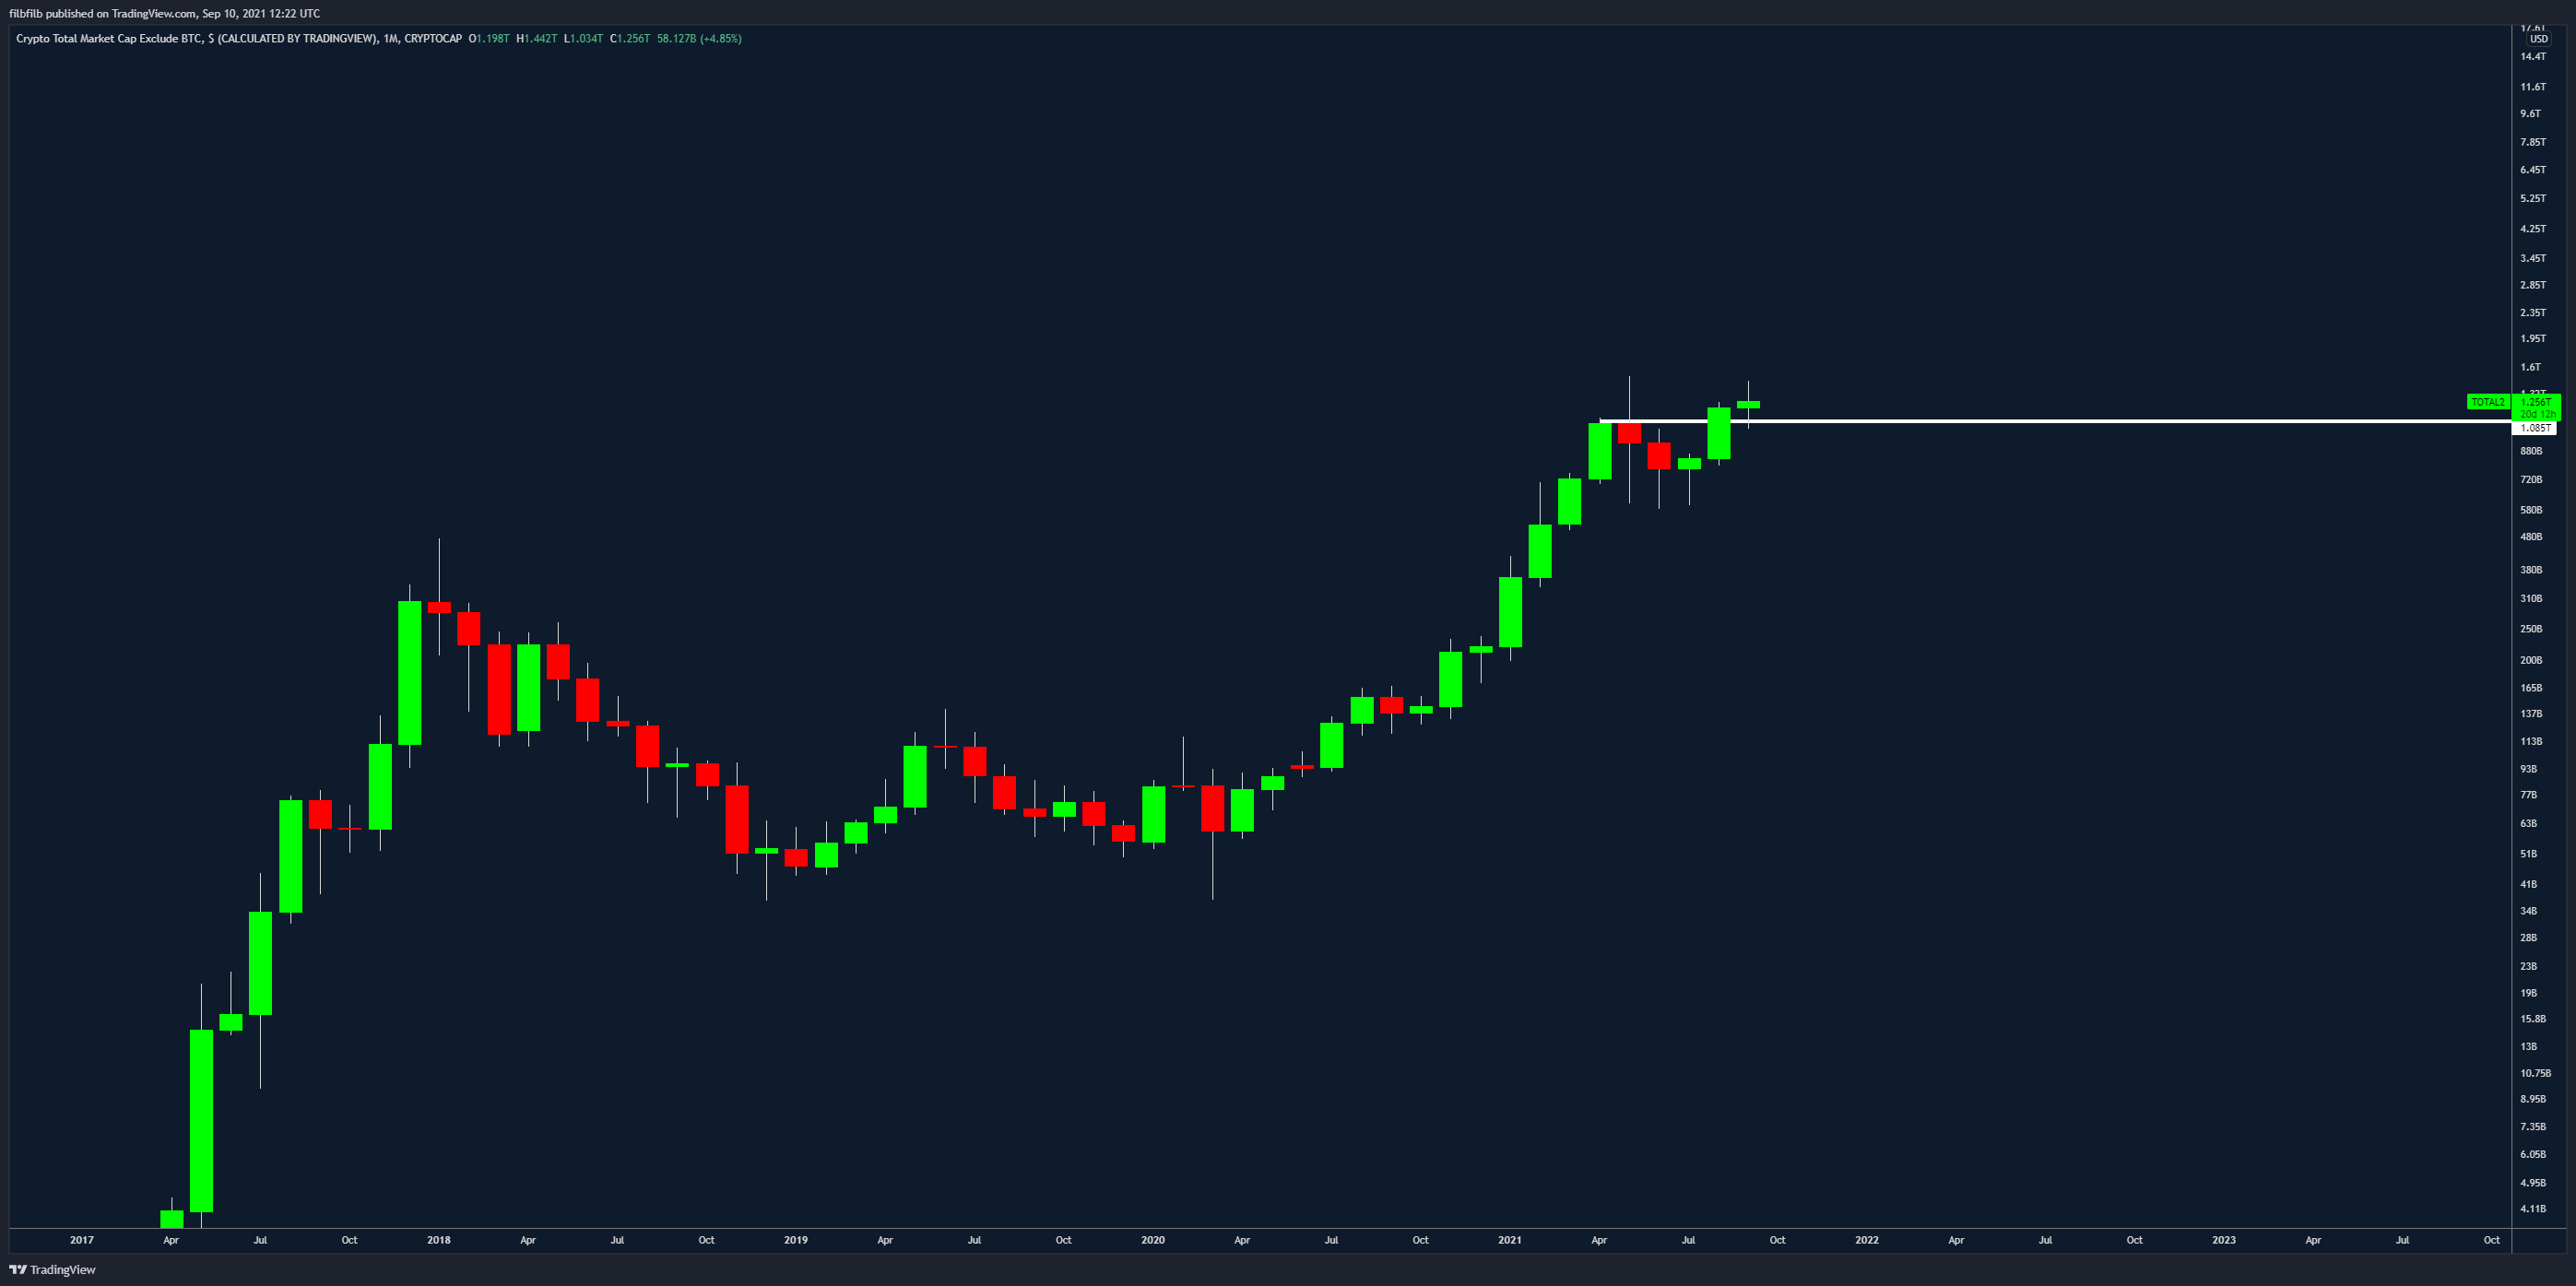
Fig. 10 Total Market Cap Excluding Bitcoin – https://www.tradingview.com/x/itJMwECx/
Bitcoin Macro Forecast; Weekly Chart
Assuming that Bitcoin can hold up around the $38k+ level, we are forecasting a strong final quarter to the year, with the next phase of the market being akin to the correction in September 2017 to 3k and the final run-up to $20k.
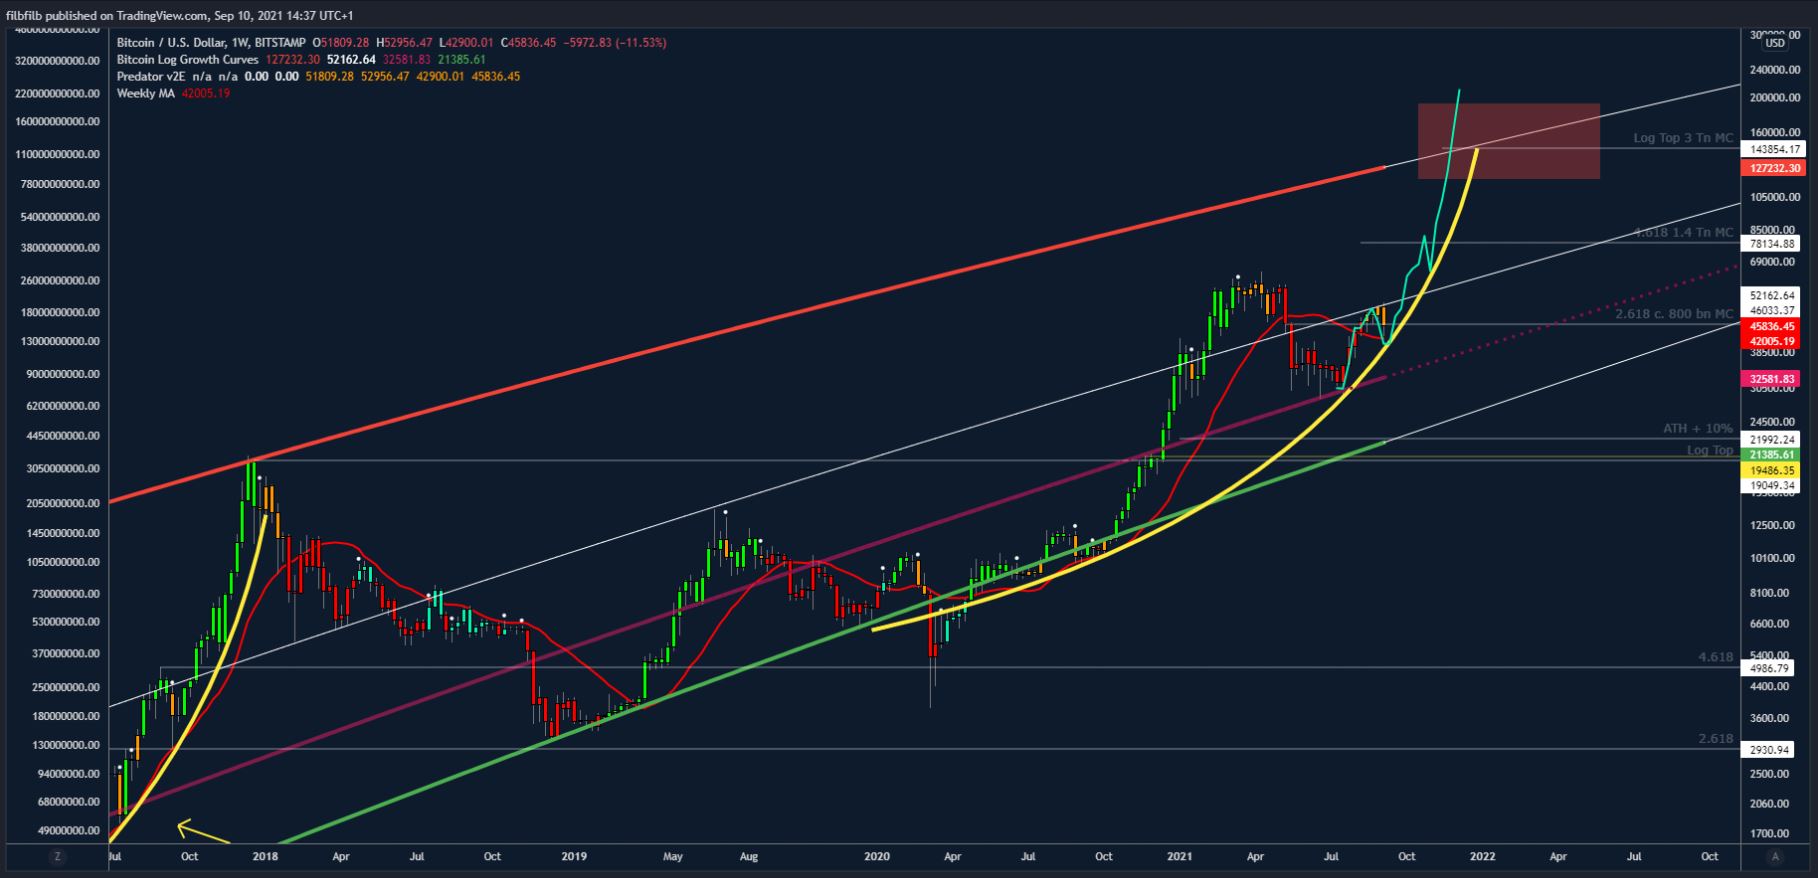
Fig. 11 – Weekly Chart with Predator indicator overlay https://www.tradingview.com/x/dVTEtkwv/
The above chart also shows the weekly predator indicator which issued a warning at $60k that the market was ready to dump; we are now displaying an orange candle which shows that the market is close to resuming the full bullish trend. Ideally, we will have a strong bounce and get a green confirmation that the macro bullish trend is ready to resume.
We are anticipating the $60k level to be retested sometime early in Q4, which will likely provide another correction with a final push to all-time highs towards the end of the year. We will need to pay particular attention to momentum if/when Bitcoin can reach out towards $100k. Loss of volume momentum was the key to identifying the top, which is also why the predator indicator showed concern around the $58k level.
A successful Bitcoin ETF would be a fantastic catalyst to take Bitcoin across $100k; its likely something like this would be needed to push on towards the upper boundary of Price expectation.
Watchouts
Bitcoin has been somewhat correlated with corrections in the S&P500, where corrections of c. 2$ in the legacy markets have seen sharp corrections in crypto which is highlighted in the below chart.
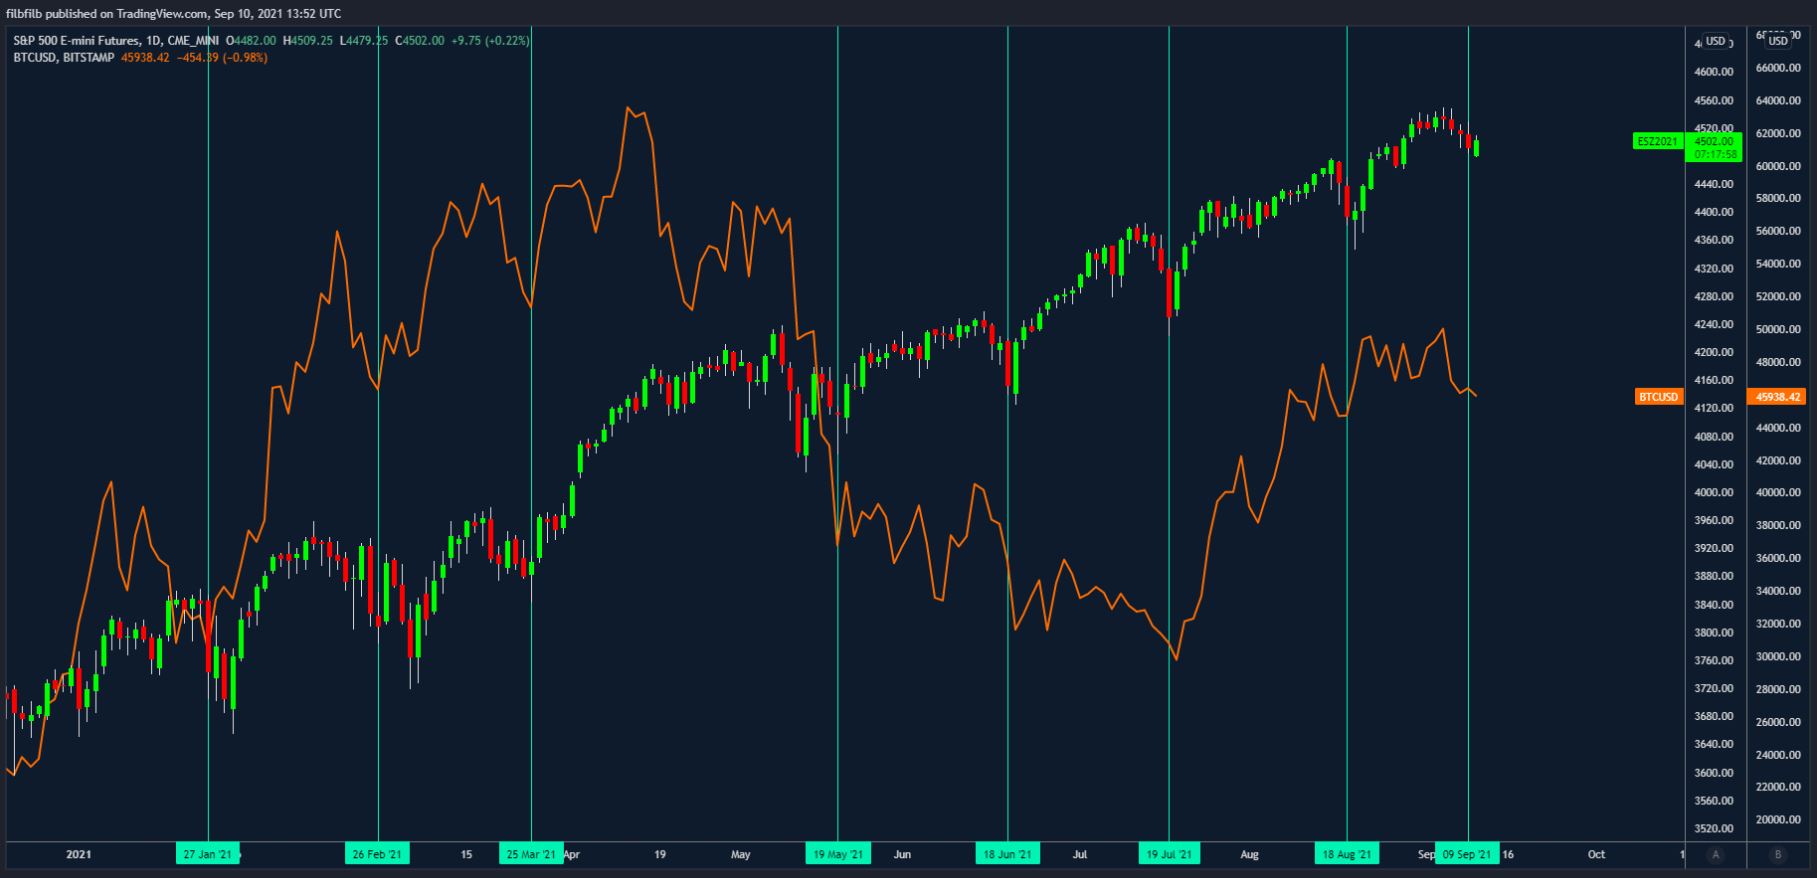
Fig. 12 – Weekly Chart with Predator indicator overlay https://www.tradingview.com/x/F83wTy6m/
As such we are particularly wary of a correction and the effect that it may have on the Bitcoin market which is obviously still considered to be a risk on asset. A longer-term correction in legacy markets would be a concern for Bitcoin and would likely harm the bull thesis for the remainder of the year.
Having said this, the S&P 500 has been particularly bullish, with large caps Apple, Amazon, and Tesla all looking particularly bullish, which gives us confidence in continued “up only” in legacy markets, which can only be positive for Bitcoin.
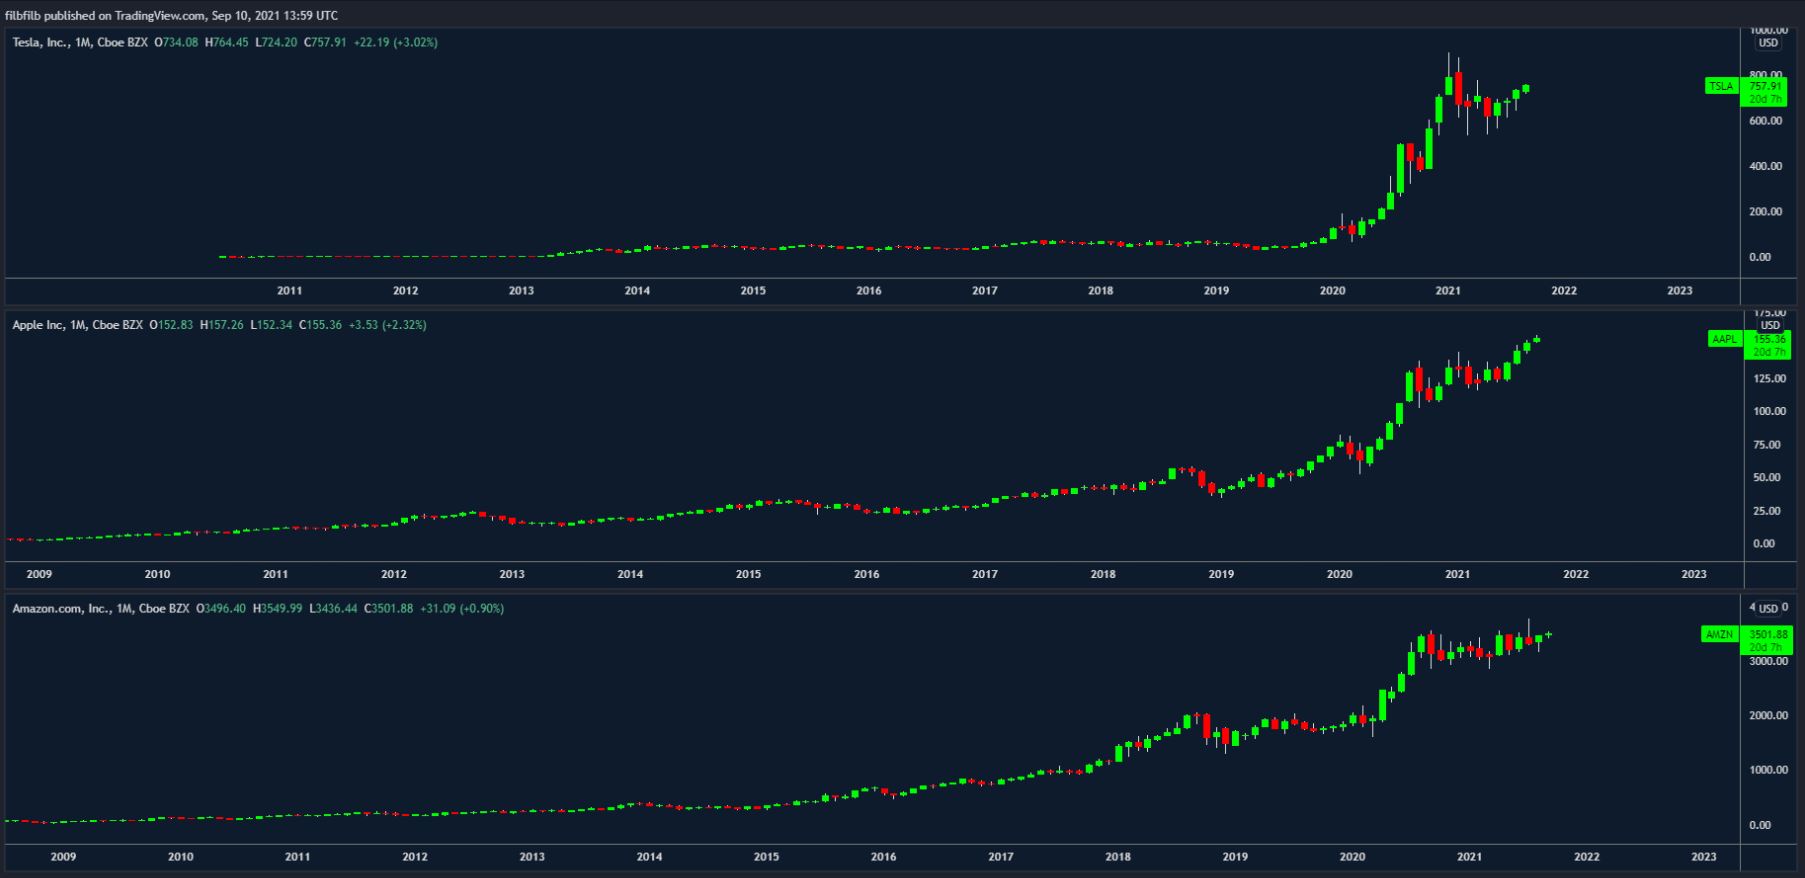
Fig. 13 – Tesla, Apple and Amazon 1 https://www.tradingview.com/x/P7mjMiLN/
Altcoins Forecast
Altcoins have been particularly strong; stronger than Bitcoin in fact, which is overall a good sign for the market, with new money easily pushing alts higher due to low liquidity and general FOMO to find value opportunities within ‘innovation in the industry’.
Our focus at Decentrader is mainly around understanding the Bitcoin market and then applying capital allocation & rotation into some Alts.
Assuming Bitcoin is going to find its feet and reach out to previous all-time highs, we expect the Altcoin market to continue to outperform the Bitcoin market, with this potentially reversing if there is a new cash flow input from something like an ETF for Bitcoin. A 1.5 Tn Bitcoin would come around $80k for bitcoin, at which point with the current trajectory Bitcoin dominance could potentially be as low as 33% which would imply that alts could potentially double their market cap from $1.2tn towards $3tn.
Given the large volume of alts and the pace that they move in the market, we use the Decentrader Commando scanner to identify the best opportunities by providing an algorithmic score, enabling us to identify the alts likely to make the big moves before they happen.
You can learn more about that HERE.
Concluding Thoughts
Putting the whole picture together, it’s clear to us why there is a bullish case for the Cryptocurrency market. We will continue to monitor the situation, but without a major pullback in the S&P500 and with support above $38k we look forward to a bullish end to 2021.
Good luck in the markets and happy trading!
Like what you read? For the regular market analysis and live streams with PositiveCrypto and FilbFilb, join us HERE. from as little as $1 per day.
Disclaimer: Nothing within this article should be misconstrued as financial advice. The financial techniques described herein are for educational purposes only. Any financial positions you take on the market are at your own risk and own reward. If you need financial advice or further advice in general, it is recommended that you identify a relevantly qualified individual in your Jurisdiction who can advise you accordingly.


