+
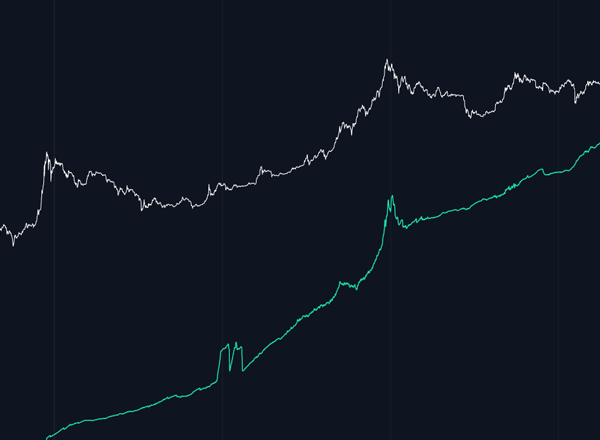
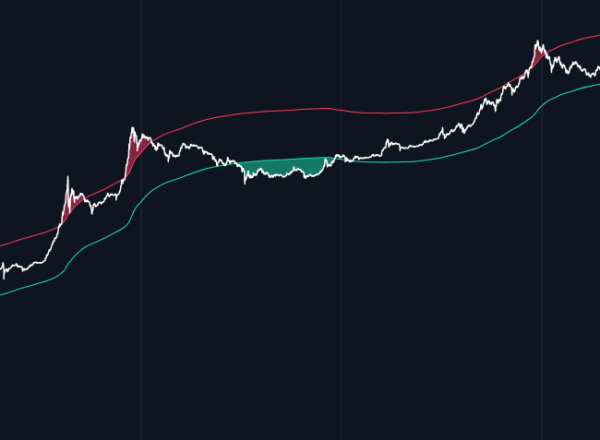
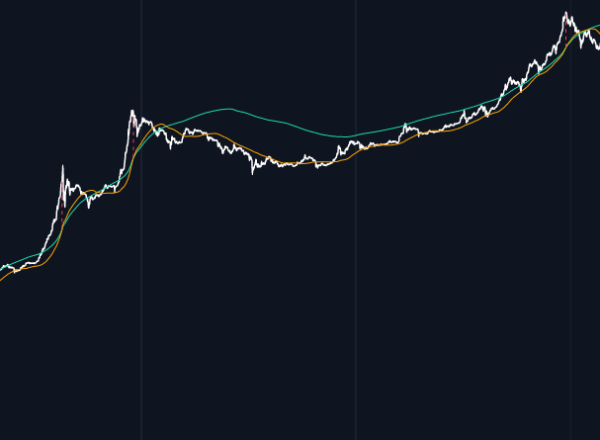
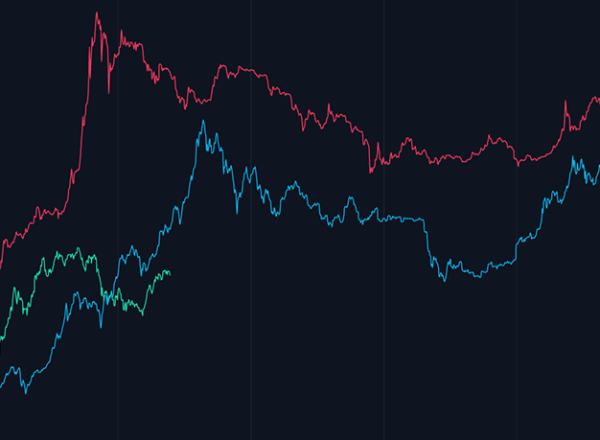
Bitcoin Investor Tool: 2-Year MA Multiplier
Simple-to-use long term $BTC investment tool for Bitcoin over macro timeframes.
+
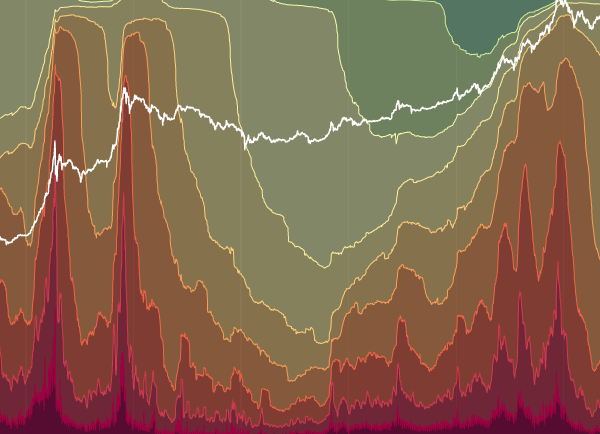
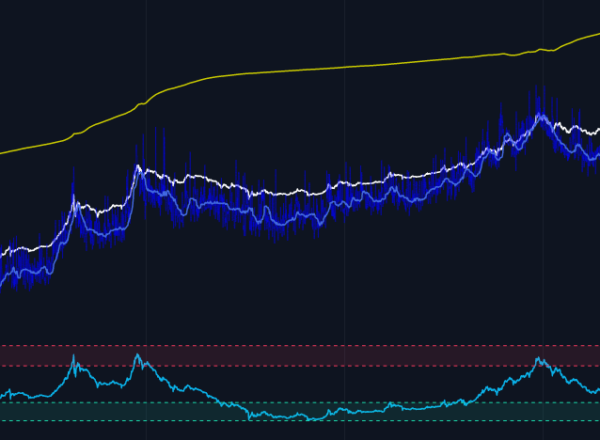
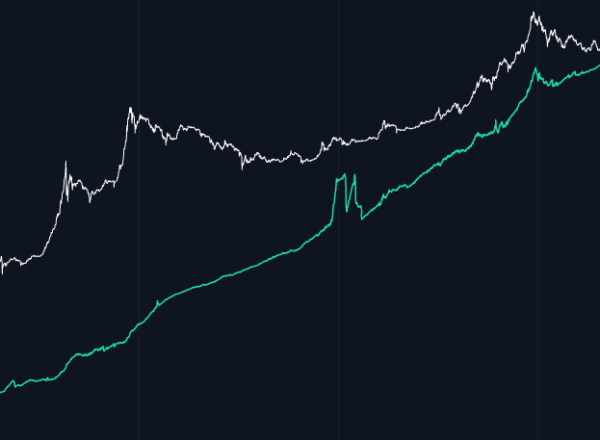
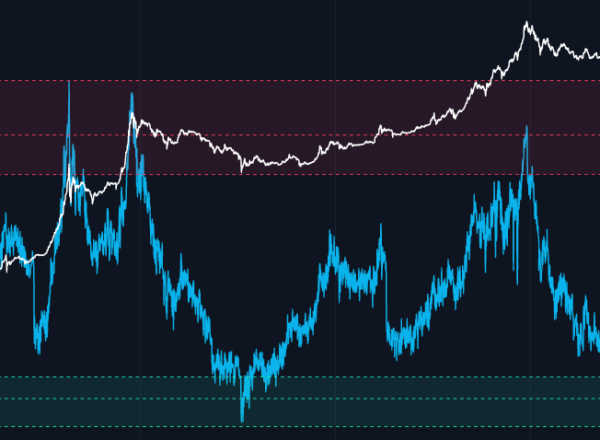
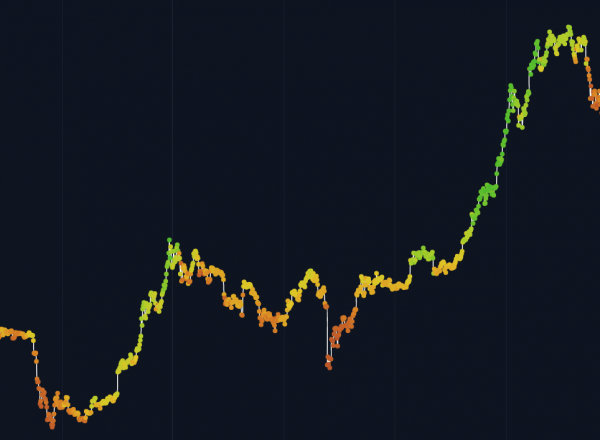
200 Week Moving Average Heatmap
A colour coded heatmap that looks at the % increases of the 200 week moving average over time.
+
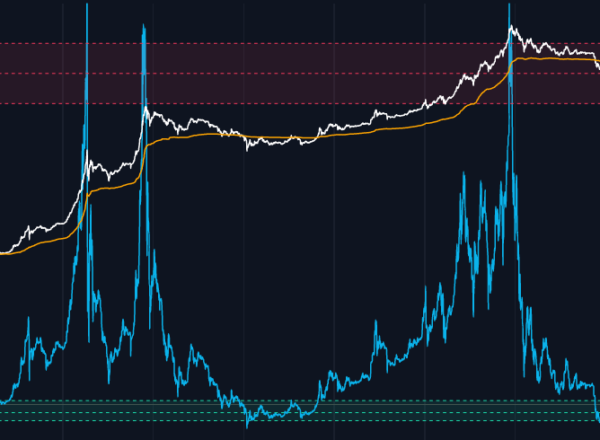
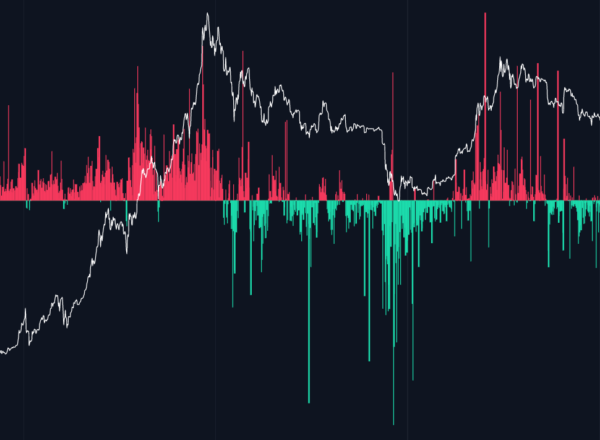
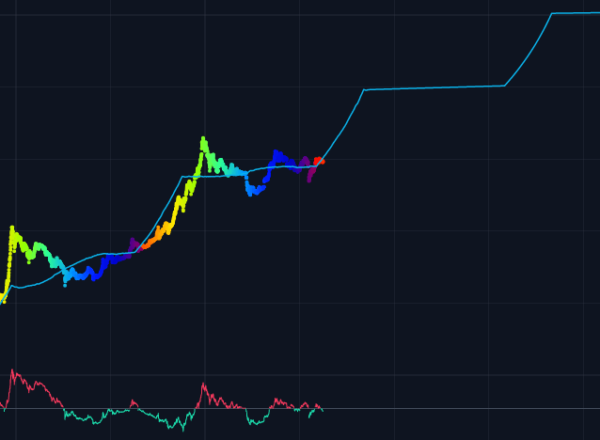
The Puell Multiple
Puell Multiple is a valuation tool for $BTC looking at Bitcoin miner revenue over time using a 1yr moving average.
+
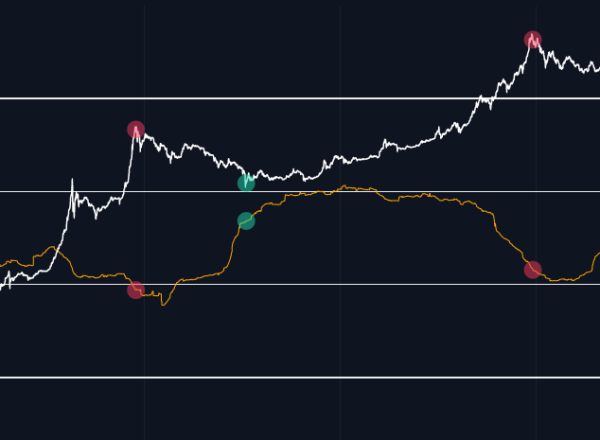
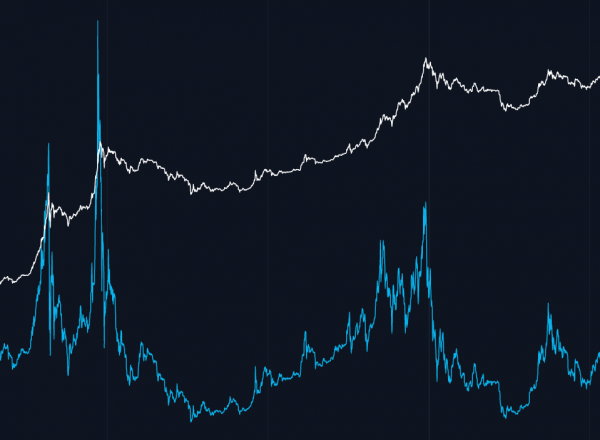
Pi Cycle Top Indicator
Pi Cycle top is a free live data chart for Bitcoin. This indicator has picked the top of previous $BTC market cycles to within 3 days.
+
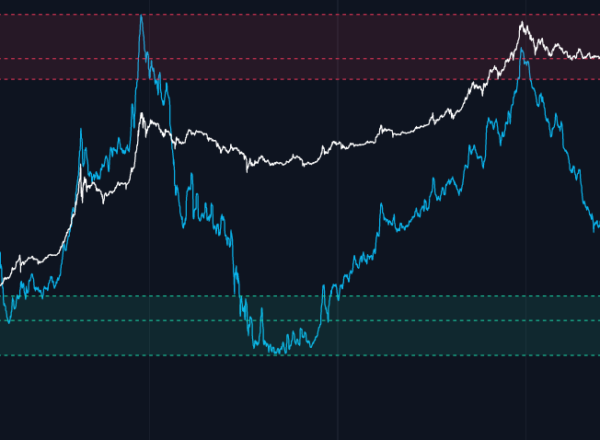
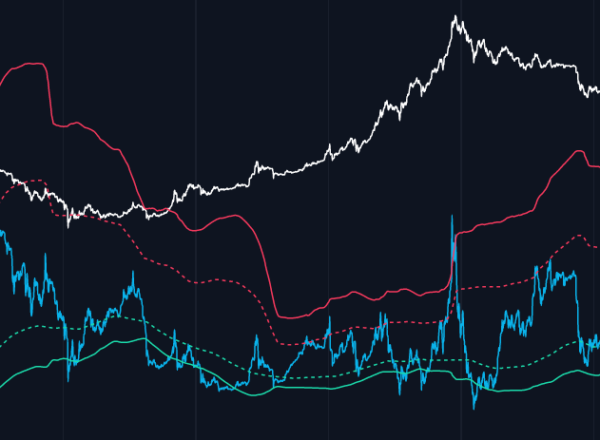
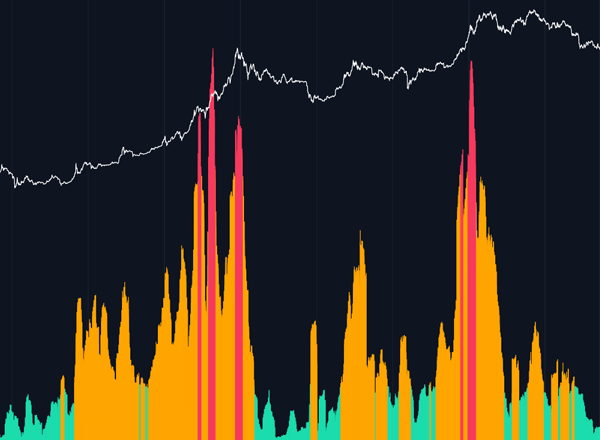
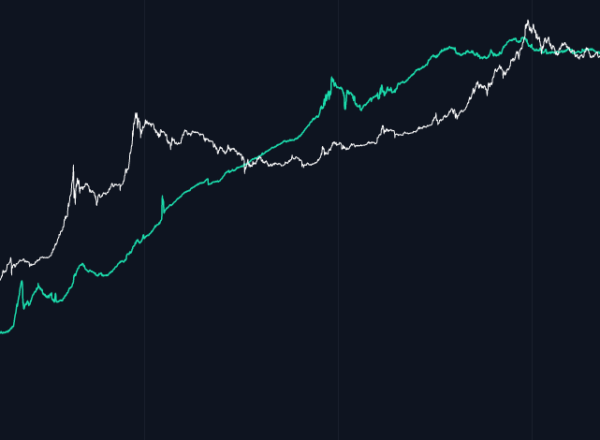
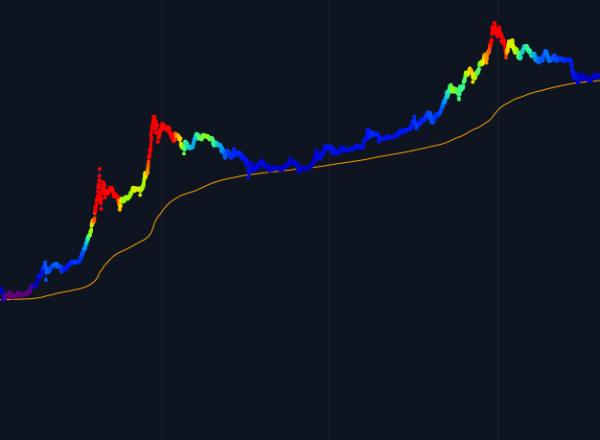
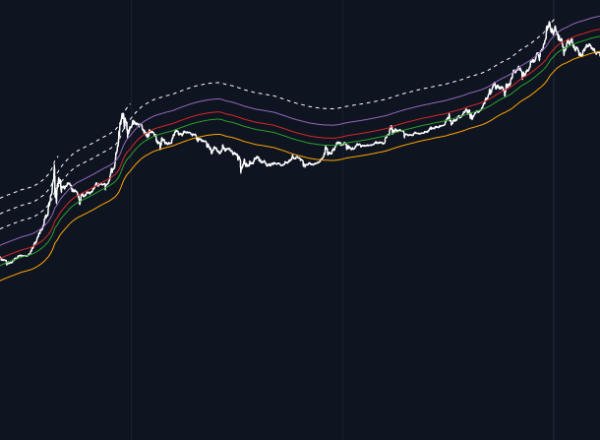
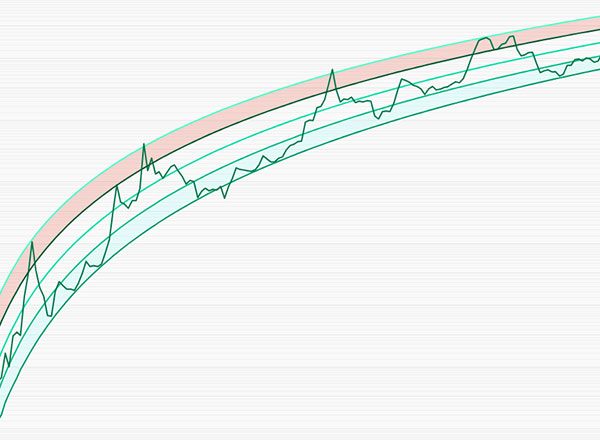
Golden Ratio Multiplier
The Golden Ratio Multiplier live chart explores Bitcoin's adoption curve and market cycles to understand $BTC price behaviour.
+
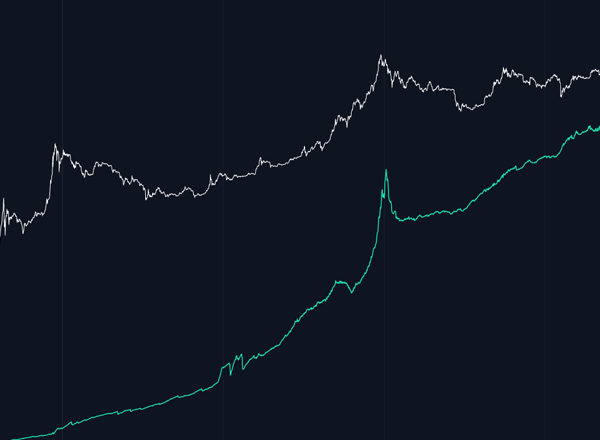
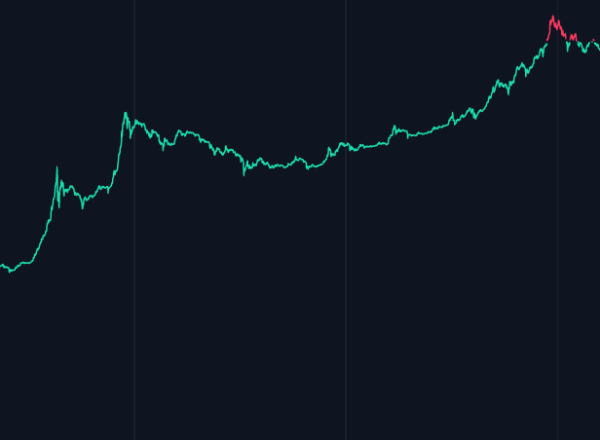
Bitcoin Profitable Days
Free live data chart showing number of days in Bitcoin's traded history where holding Bitcoin has been profitable relative to today's price.
+
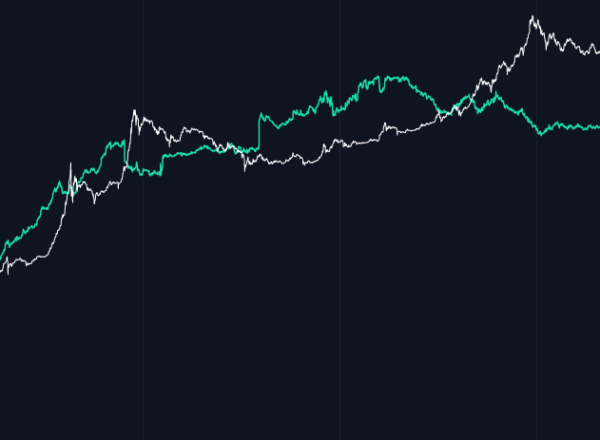
Bull Market Comparison
This chart looks at each of the 3 major Bitcoin cycles since their relative halving dates. Each line starts at the halving date and the x-axis runs on from that point in number of days.
+
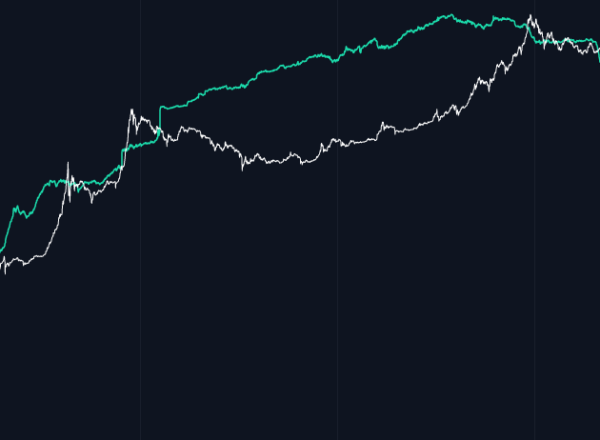
Logarithmic Pivot Point Analysis for Bitcoin Cycles
This chart is a comprehensive tool for analyzing Bitcoin's price dynamics over time, based on the historical relationship between market cycles, pivot points, and logarithmic trends.